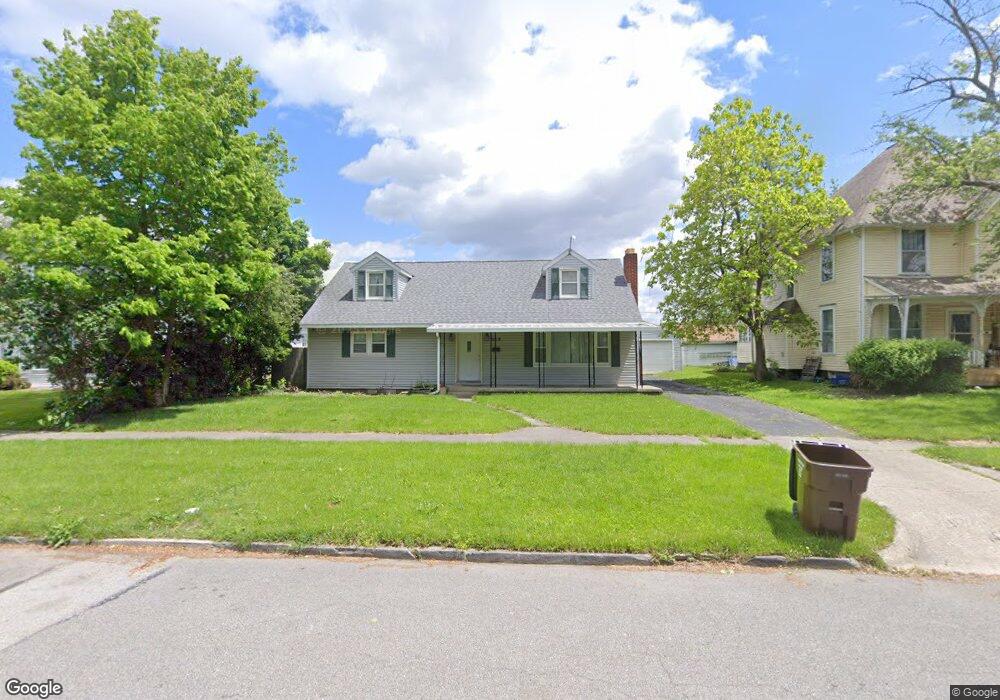
619 N Main St Paulding, OH 45879
Estimated Value: $137,549 - $181,000
4
Beds
1
Bath
1,823
Sq Ft
$88/Sq Ft
Est. Value
About This Home
This home is located at 619 N Main St, Paulding, OH 45879 and is currently estimated at $160,637, approximately $88 per square foot. 619 N Main St is a home located in Paulding County with nearby schools including Paulding High School.
Ownership History
Date
Name
Owned For
Owner Type
Purchase Details
Closed on
Jan 28, 2009
Sold by
Hsbc Bank Usa
Bought by
Ousley Jonathan J
Current Estimated Value
Home Financials for this Owner
Home Financials are based on the most recent Mortgage that was taken out on this home.
Original Mortgage
$51,816
Outstanding Balance
$31,700
Interest Rate
4.91%
Mortgage Type
FHA
Estimated Equity
$128,937
Purchase Details
Closed on
Feb 5, 2008
Sold by
Dominique Jason E
Bought by
Hsbc Bank Usa N A
Purchase Details
Closed on
Jun 30, 2005
Sold by
Riggenbach Carie Lynn C and Riggenbach David D
Bought by
Dominique Jason E and Dominique Lori K
Home Financials for this Owner
Home Financials are based on the most recent Mortgage that was taken out on this home.
Original Mortgage
$89,000
Interest Rate
8.99%
Mortgage Type
Adjustable Rate Mortgage/ARM
Purchase Details
Closed on
Aug 30, 2001
Sold by
Santo Richard J
Bought by
Ousley Jonathan J
Purchase Details
Closed on
Jun 14, 1991
Bought by
Ousley Jonathan J
Create a Home Valuation Report for This Property
The Home Valuation Report is an in-depth analysis detailing your home's value as well as a comparison with similar homes in the area
Home Values in the Area
Average Home Value in this Area
Purchase History
We collect this data history from publicly available records. To have your information removed, we recommend requesting removal directly through your county’s website.
| Date | Buyer | Sale Price | Title Company |
|---|---|---|---|
| Ousley Jonathan J | $52,500 | None Available | |
| Hsbc Bank Usa N A | $49,000 | None Available | |
| Dominique Jason E | $89,000 | None Available | |
| Ousley Jonathan J | -- | -- | |
| Ousley Jonathan J | $100 | -- |
Source: Public Records
Mortgage History
We collect this data history from publicly available records. To have your information removed, we recommend requesting removal directly through your county’s website.
| Date | Status | Borrower | Loan Amount |
|---|---|---|---|
| Open | Ousley Jonathan J | $51,816 | |
| Previous Owner | Dominique Jason E | $89,000 |
Source: Public Records
Tax History
| Year | Tax Paid | Tax Assessment Tax Assessment Total Assessment is a certain percentage of the fair market value that is determined by local assessors to be the total taxable value of land and additions on the property. | Land | Improvement |
|---|---|---|---|---|
| 2025 | $1,845 | $42,630 | $4,900 | $37,730 |
| 2024 | $1,845 | $36,440 | $4,200 | $32,240 |
| 2023 | $1,638 | $36,440 | $4,200 | $32,240 |
| 2022 | $1,588 | $36,440 | $4,200 | $32,240 |
| 2021 | $1,387 | $28,350 | $3,780 | $24,570 |
| 2020 | $1,240 | $28,350 | $3,780 | $24,570 |
| 2019 | $1,250 | $27,200 | $3,780 | $23,420 |
| 2018 | $1,221 | $27,200 | $3,780 | $23,420 |
| 2017 | $1,223 | $27,200 | $3,780 | $23,420 |
| 2016 | $1,223 | $27,200 | $3,780 | $23,420 |
| 2015 | $1,224 | $27,650 | $4,270 | $23,380 |
| 2014 | $1,218 | $27,650 | $4,270 | $23,380 |
| 2013 | $1,318 | $27,650 | $4,270 | $23,380 |
Source: Public Records
Map
Nearby Homes
- 516 N Williams St
- 713 N Walnut St
- 301 N Main St
- 830 N Walnut St
- 215 N Dewitt St
- 111 W Wayne St
- 335 S Williams St
- 780 W Jackson St
- 809 Country View Dr
- 714 W Wayne St
- 742 E Perry St
- 12035 Royer Ave
- 1157 Emerald Rd
- 13502 Rita St
- 13795 Nancy St
- 11051 Road 93
- 9266 Road 107
- 9881 Road 180
- 17341 Road 139
- 14364 Road 171
Your Personal Tour Guide
Ask me questions while you tour the home.