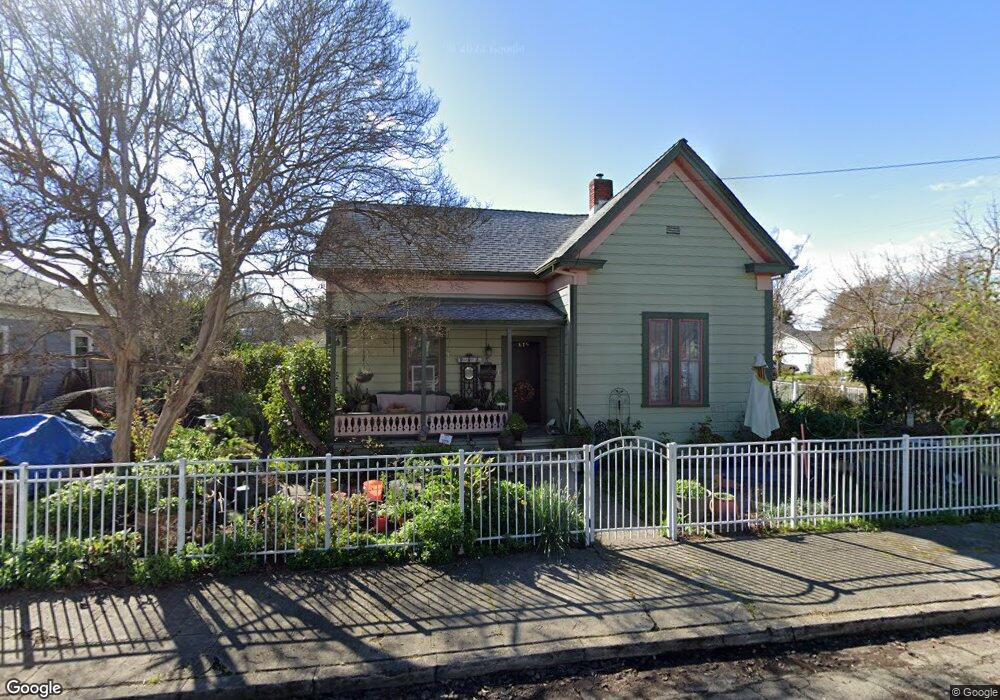
619 Polk St Santa Rosa, CA 95401
Historic Railroad Square NeighborhoodEstimated Value: $662,000 - $845,000
4
Beds
1
Bath
1,737
Sq Ft
$419/Sq Ft
Est. Value
About This Home
This home is located at 619 Polk St, Santa Rosa, CA 95401 and is currently estimated at $727,644, approximately $418 per square foot. 619 Polk St is a home located in Sonoma County with nearby schools including Abraham Lincoln Elementary School, Santa Rosa Middle School, and Santa Rosa High School.
Ownership History
Date
Name
Owned For
Owner Type
Purchase Details
Closed on
Sep 9, 2014
Sold by
Crippen Deborah L
Bought by
Crippen Deborah L and The Deborah L Crippen Trust
Current Estimated Value
Purchase Details
Closed on
Mar 16, 1998
Sold by
Hemenway Lisa R and Hemenway Marc I
Bought by
Crippen Deborah
Home Financials for this Owner
Home Financials are based on the most recent Mortgage that was taken out on this home.
Original Mortgage
$125,000
Outstanding Balance
$22,948
Interest Rate
7.06%
Estimated Equity
$704,696
Purchase Details
Closed on
Jan 3, 1996
Sold by
Hemenway Phillip
Bought by
Hauptman Marc I and Hemenway Lisa R
Home Financials for this Owner
Home Financials are based on the most recent Mortgage that was taken out on this home.
Original Mortgage
$13,250
Interest Rate
7.18%
Create a Home Valuation Report for This Property
The Home Valuation Report is an in-depth analysis detailing your home's value as well as a comparison with similar homes in the area
Home Values in the Area
Average Home Value in this Area
Purchase History
| Date | Buyer | Sale Price | Title Company |
|---|---|---|---|
| Crippen Deborah L | -- | None Available | |
| Crippen Deborah | $185,000 | Old Republic Title Company | |
| Hauptman Marc I | $4,500 | Fidelity National Title Ins |
Source: Public Records
Mortgage History
| Date | Status | Borrower | Loan Amount |
|---|---|---|---|
| Open | Crippen Deborah | $125,000 | |
| Previous Owner | Hauptman Marc I | $13,250 |
Source: Public Records
Tax History Compared to Growth
Tax History
| Year | Tax Paid | Tax Assessment Tax Assessment Total Assessment is a certain percentage of the fair market value that is determined by local assessors to be the total taxable value of land and additions on the property. | Land | Improvement |
|---|---|---|---|---|
| 2025 | $5,033 | $449,416 | $118,590 | $330,826 |
| 2024 | $5,033 | $440,605 | $116,265 | $324,340 |
| 2023 | $5,033 | $290,473 | $113,986 | $176,487 |
| 2022 | $3,114 | $284,778 | $111,751 | $173,027 |
| 2021 | $3,074 | $279,195 | $109,560 | $169,635 |
| 2020 | $3,066 | $276,333 | $108,437 | $167,896 |
| 2019 | $3,048 | $270,915 | $106,311 | $164,604 |
| 2018 | $2,960 | $259,604 | $98,227 | $161,377 |
| 2017 | $2,906 | $254,514 | $96,301 | $158,213 |
| 2016 | $2,878 | $249,524 | $94,413 | $155,111 |
| 2015 | $2,790 | $245,777 | $92,995 | $152,782 |
| 2014 | $2,455 | $226,000 | $86,000 | $140,000 |
Source: Public Records
Map
Nearby Homes