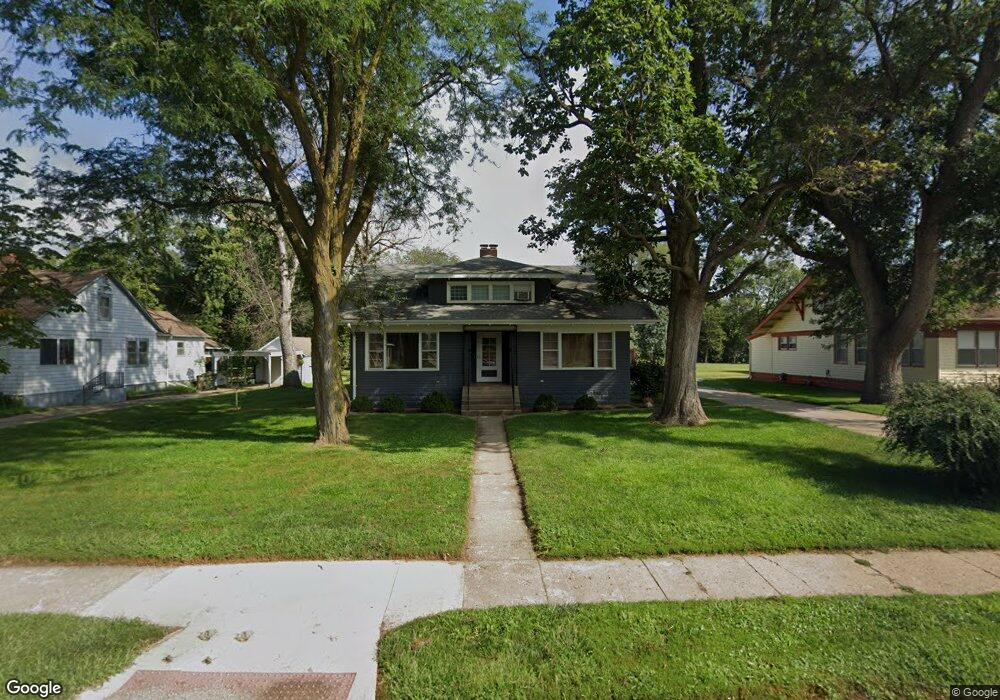
619 Sioux St Mapleton, IA 51034
Estimated Value: $149,000 - $200,003
4
Beds
2
Baths
2,351
Sq Ft
$76/Sq Ft
Est. Value
About This Home
This home is located at 619 Sioux St, Mapleton, IA 51034 and is currently estimated at $178,501, approximately $75 per square foot. 619 Sioux St is a home located in Monona County with nearby schools including Mapleton Elementary School, Mvao Middle School, and Maple Valley-Anthon Oto High School.
Ownership History
Date
Name
Owned For
Owner Type
Purchase Details
Closed on
Jul 30, 2021
Sold by
Cook John P
Bought by
Krusen Joseph J
Current Estimated Value
Home Financials for this Owner
Home Financials are based on the most recent Mortgage that was taken out on this home.
Original Mortgage
$127,000
Outstanding Balance
$22,932
Interest Rate
2.93%
Mortgage Type
New Conventional
Estimated Equity
$155,569
Create a Home Valuation Report for This Property
The Home Valuation Report is an in-depth analysis detailing your home's value as well as a comparison with similar homes in the area
Purchase History
| Date | Buyer | Sale Price | Title Company |
|---|---|---|---|
| Krusen Joseph J | $115,500 | None Listed On Document |
Source: Public Records
Mortgage History
| Date | Status | Borrower | Loan Amount |
|---|---|---|---|
| Open | Krusen Joseph J | $127,000 |
Source: Public Records
Tax History
| Year | Tax Paid | Tax Assessment Tax Assessment Total Assessment is a certain percentage of the fair market value that is determined by local assessors to be the total taxable value of land and additions on the property. | Land | Improvement |
|---|---|---|---|---|
| 2024 | $2,244 | $140,115 | $14,883 | $125,232 |
| 2023 | $2,116 | $0 | $0 | $0 |
| 2022 | $882 | $65,283 | $12,403 | $52,880 |
| 2021 | $930 | $65,283 | $12,403 | $52,880 |
| 2020 | $1,014 | $65,283 | $12,403 | $52,880 |
| 2019 | $1,014 | $66,999 | $0 | $0 |
| 2018 | $986 | $66,999 | $0 | $0 |
| 2017 | $960 | $63,809 | $0 | $0 |
| 2016 | $960 | $63,809 | $0 | $0 |
| 2015 | $902 | $56,468 | $0 | $0 |
| 2014 | $802 | $56,468 | $0 | $0 |
Source: Public Records
Map
Nearby Homes
Your Personal Tour Guide
Ask me questions while you tour the home.