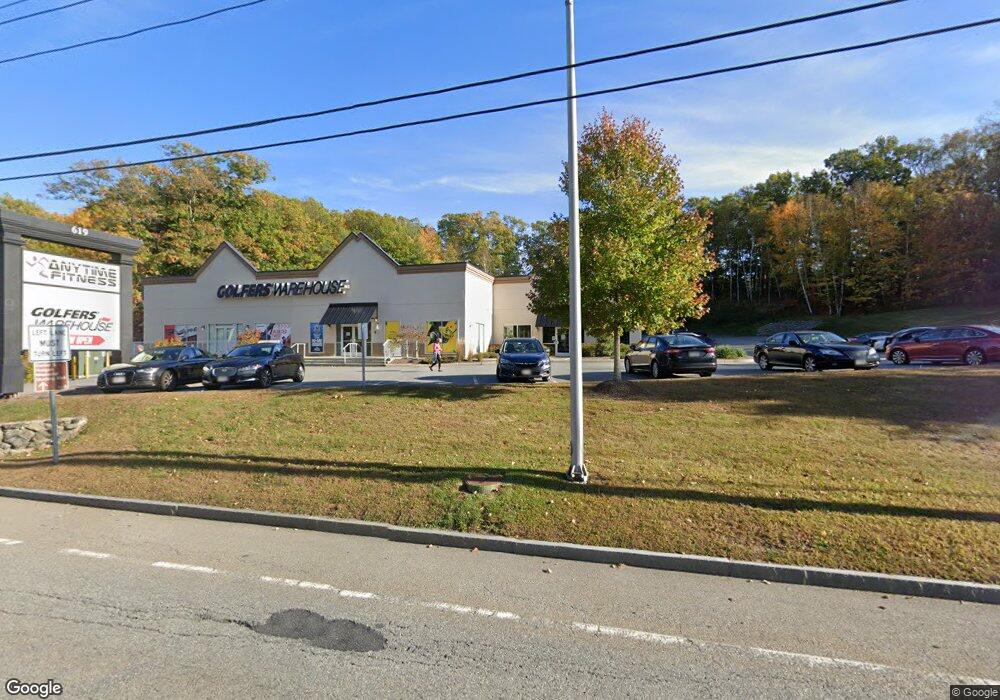
619 Southbridge St Auburn, MA 01501
West Auburn NeighborhoodEstimated Value: $2,074,367
--
Bed
5
Baths
17,280
Sq Ft
$120/Sq Ft
Est. Value
About This Home
This home is located at 619 Southbridge St, Auburn, MA 01501 and is currently estimated at $2,074,367, approximately $120 per square foot. 619 Southbridge St is a home located in Worcester County with nearby schools including Auburn Senior High School and Shrewsbury Montessori School - Auburn Campus.
Ownership History
Date
Name
Owned For
Owner Type
Purchase Details
Closed on
Apr 25, 2013
Sold by
Capital Realty Advisor
Bought by
Southbridge Street Hld
Current Estimated Value
Purchase Details
Closed on
Apr 28, 2010
Sold by
Goodwin Andrew E and Goodwin Lee D
Bought by
619 Southbridge St Llc
Home Financials for this Owner
Home Financials are based on the most recent Mortgage that was taken out on this home.
Original Mortgage
$550,000
Interest Rate
4.99%
Mortgage Type
Commercial
Create a Home Valuation Report for This Property
The Home Valuation Report is an in-depth analysis detailing your home's value as well as a comparison with similar homes in the area
Home Values in the Area
Average Home Value in this Area
Purchase History
| Date | Buyer | Sale Price | Title Company |
|---|---|---|---|
| Southbridge Street Hld | -- | -- | |
| 619 Southbridge St Llc | -- | -- | |
| 619 Southbridge St Llc | $200,000 | -- | |
| 619 Southbridge St Llc | $292,000 | -- |
Source: Public Records
Mortgage History
| Date | Status | Borrower | Loan Amount |
|---|---|---|---|
| Previous Owner | 619 Southbridge St Llc | $550,000 |
Source: Public Records
Tax History Compared to Growth
Tax History
| Year | Tax Paid | Tax Assessment Tax Assessment Total Assessment is a certain percentage of the fair market value that is determined by local assessors to be the total taxable value of land and additions on the property. | Land | Improvement |
|---|---|---|---|---|
| 2025 | $283 | $1,760,400 | $339,700 | $1,420,700 |
| 2024 | $26,696 | $1,588,100 | $323,000 | $1,265,100 |
| 2023 | $28,593 | $1,538,900 | $323,000 | $1,215,900 |
| 2022 | $30,097 | $1,465,300 | $323,000 | $1,142,300 |
| 2021 | $5,716 | $1,416,200 | $323,000 | $1,093,200 |
| 2020 | $33,875 | $1,514,300 | $323,000 | $1,191,300 |
| 2019 | $34,896 | $1,502,200 | $323,000 | $1,179,200 |
| 2018 | $93 | $1,463,300 | $323,000 | $1,140,300 |
| 2017 | $35,353 | $1,463,300 | $323,000 | $1,140,300 |
| 2016 | $33,596 | $1,376,900 | $308,300 | $1,068,600 |
| 2015 | $30,543 | $1,313,100 | $308,300 | $1,004,800 |
| 2014 | $22,360 | $857,700 | $304,200 | $553,500 |
Source: Public Records
Map
Nearby Homes