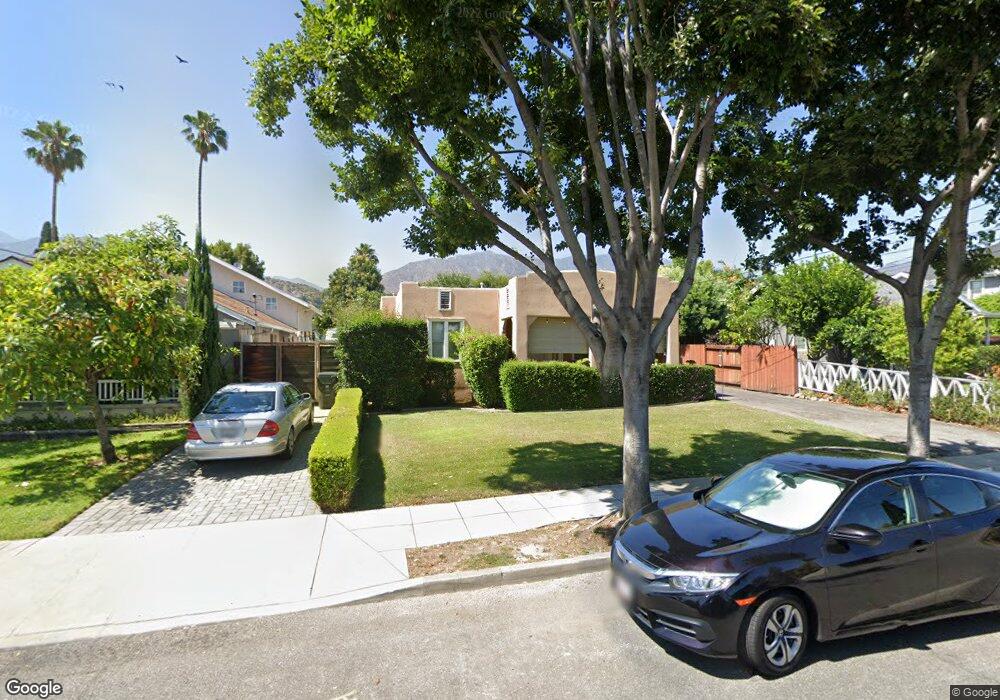
619 W Lime Ave Monrovia, CA 91016
Estimated Value: $1,011,051 - $1,104,000
5
Beds
2
Baths
1,938
Sq Ft
$539/Sq Ft
Est. Value
About This Home
This home is located at 619 W Lime Ave, Monrovia, CA 91016 and is currently estimated at $1,044,013, approximately $538 per square foot. 619 W Lime Ave is a home located in Los Angeles County with nearby schools including Monroe Elementary School, Santa Fe Computer Science Magnet, and Monrovia High School.
Ownership History
Date
Name
Owned For
Owner Type
Purchase Details
Closed on
Nov 13, 2023
Sold by
Dickson Virginia O
Bought by
Virginia O Dickson Family Trust and Dickson
Current Estimated Value
Purchase Details
Closed on
Aug 15, 2014
Sold by
Dickson Virginia O and Dickson Byron L
Bought by
Byron L & Virginia O Dickson Family Trus
Purchase Details
Closed on
Oct 8, 2013
Sold by
Dickson Virginia O and Dickson Byron L
Bought by
Dickson Virginia O and Dickson Byron L
Purchase Details
Closed on
Dec 17, 1998
Sold by
Dickson Byron and Dickson Virginia O
Bought by
Dickson Byron L and Dickson Virginia
Create a Home Valuation Report for This Property
The Home Valuation Report is an in-depth analysis detailing your home's value as well as a comparison with similar homes in the area
Home Values in the Area
Average Home Value in this Area
Purchase History
| Date | Buyer | Sale Price | Title Company |
|---|---|---|---|
| Virginia O Dickson Family Trust | -- | None Listed On Document | |
| Dickson Virginia O | -- | None Listed On Document | |
| Byron L & Virginia O Dickson Family Trus | -- | None Available | |
| Dickson Virginia O | -- | None Available | |
| Dickson Byron L | -- | -- |
Source: Public Records
Tax History
| Year | Tax Paid | Tax Assessment Tax Assessment Total Assessment is a certain percentage of the fair market value that is determined by local assessors to be the total taxable value of land and additions on the property. | Land | Improvement |
|---|---|---|---|---|
| 2025 | $5,151 | $345,570 | $145,969 | $199,601 |
| 2024 | $5,151 | $338,795 | $143,107 | $195,688 |
| 2023 | $5,040 | $332,152 | $140,301 | $191,851 |
| 2022 | $4,902 | $325,640 | $137,550 | $188,090 |
| 2021 | $4,802 | $319,255 | $134,853 | $184,402 |
| 2020 | $4,668 | $315,983 | $133,471 | $182,512 |
| 2019 | $4,591 | $309,788 | $130,854 | $178,934 |
| 2018 | $4,427 | $303,715 | $128,289 | $175,426 |
| 2016 | $4,250 | $291,923 | $123,308 | $168,615 |
| 2015 | $4,162 | $287,539 | $121,456 | $166,083 |
| 2014 | $4,130 | $281,907 | $119,077 | $162,830 |
Source: Public Records
Map
Nearby Homes
- 221 Violet Ave
- 516 Linwood Ave
- 755 W Colorado Blvd
- 105 S Mayflower Ave Unit E
- 309 S Alta Vista Ave
- 334 Linwood Ave
- 729 W Foothill Blvd
- 112 N Garfield Place
- 239 W Lemon Ave
- 239 W Palm Ave
- 267 Linwood Ave Unit E
- 855 W Walnut Ave
- 108 Peppertree Ln
- 210 W Lime Ave
- 919 W Olive Ave Unit B
- 924 W Colorado Blvd
- 725 W Hillcrest Blvd
- 891 Crescent Dr
- 228 Oaks Ave
- 137 N Myrtle Ave
Your Personal Tour Guide
Ask me questions while you tour the home.