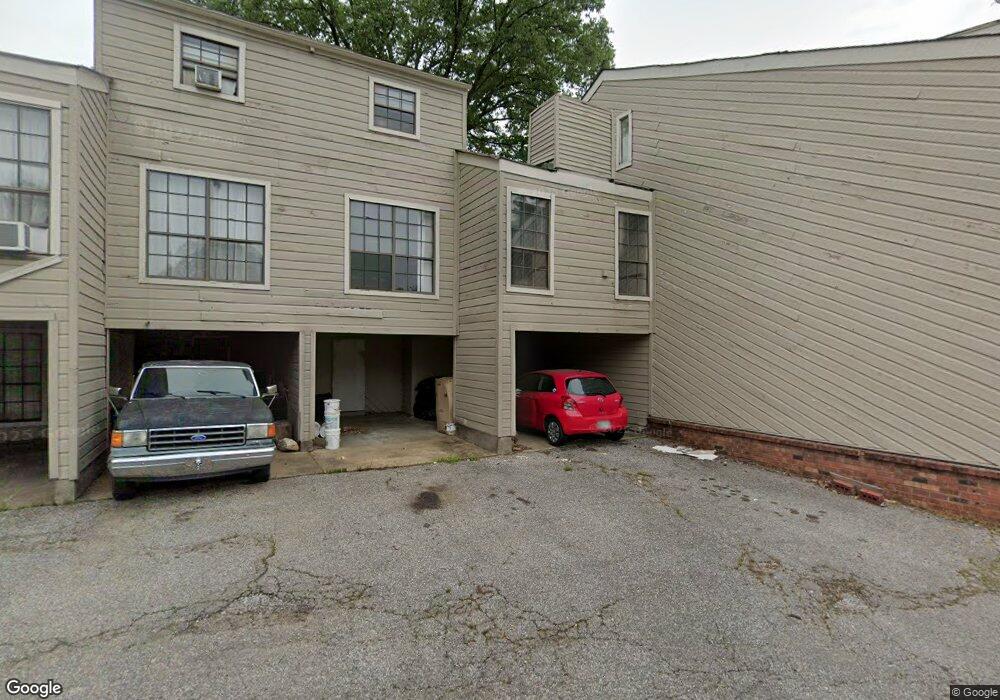
6190 Ashton Rd Unit 14 Memphis, TN 38134
Estimated Value: $49,000 - $111,000
2
Beds
2
Baths
1,605
Sq Ft
$43/Sq Ft
Est. Value
About This Home
This home is located at 6190 Ashton Rd Unit 14, Memphis, TN 38134 and is currently estimated at $69,290, approximately $43 per square foot. 6190 Ashton Rd Unit 14 is a home located in Shelby County with nearby schools including Shelby Oaks Elementary School, Kate Bond Middle School, and Kingsbury High School.
Ownership History
Date
Name
Owned For
Owner Type
Purchase Details
Closed on
May 2, 2018
Sold by
The Summer Hill Homeowners Assocaition
Bought by
Little Glenn
Current Estimated Value
Purchase Details
Closed on
May 10, 2017
Sold by
Philips John B
Bought by
The Summer Hills Homeowners Association
Purchase Details
Closed on
Jan 20, 2016
Sold by
Harbour Portfolio Viii Lp
Bought by
Silver Stream Advisors Llc
Purchase Details
Closed on
Jul 31, 2014
Sold by
Fannie Mae
Bought by
Harbour Portfolio Viii Lp
Purchase Details
Closed on
Feb 7, 2014
Sold by
Williams Sheila and Williams Tyrone C
Bought by
Federal National Mortgage Association
Purchase Details
Closed on
Nov 9, 2007
Sold by
Wring Aubrey B and Wring Virginia A
Bought by
Williams Tyrone C and Williams Shelia
Purchase Details
Closed on
Jan 2, 1996
Sold by
Wring Bruce
Bought by
A & B Enterprise Lp
Create a Home Valuation Report for This Property
The Home Valuation Report is an in-depth analysis detailing your home's value as well as a comparison with similar homes in the area
Home Values in the Area
Average Home Value in this Area
Purchase History
| Date | Buyer | Sale Price | Title Company |
|---|---|---|---|
| Little Glenn | -- | None Available | |
| The Summer Hills Homeowners Association | $9,331 | None Available | |
| Silver Stream Advisors Llc | -- | None Available | |
| Silver Stream Advisors Llc | -- | None Available | |
| Harbour Portfolio Viii Lp | $9,543 | Servicelink | |
| Federal National Mortgage Association | $48,914 | None Available | |
| Williams Tyrone C | $42,500 | None Available | |
| A & B Enterprise Lp | -- | -- |
Source: Public Records
Tax History Compared to Growth
Tax History
| Year | Tax Paid | Tax Assessment Tax Assessment Total Assessment is a certain percentage of the fair market value that is determined by local assessors to be the total taxable value of land and additions on the property. | Land | Improvement |
|---|---|---|---|---|
| 2025 | $136 | $4,240 | $1,240 | $3,000 |
| 2024 | $136 | $4,000 | $775 | $3,225 |
| 2023 | $244 | $4,000 | $775 | $3,225 |
| 2022 | $244 | $4,000 | $775 | $3,225 |
| 2021 | $373 | $6,050 | $775 | $5,275 |
| 2020 | $259 | $3,575 | $775 | $2,800 |
| 2019 | $297 | $4,100 | $775 | $3,325 |
| 2018 | $297 | $4,100 | $775 | $3,325 |
| 2017 | $189 | $4,600 | $775 | $3,825 |
| 2016 | $382 | $8,750 | $0 | $0 |
| 2014 | $612 | $14,000 | $0 | $0 |
Source: Public Records
Map
Nearby Homes
- 0 Summer Ave Unit 10200827
- 0 Summer Ave Unit 10195870
- 0 Summer Ave Unit 10195869
- 6321 Ashton Rd
- 6014 Raleigh Lagrange Rd
- 2233 Woodfield Park Rd
- 2205 Oldfield Dr
- 2180 Henrietta Rd
- 2426 Lacosta Dr
- 5981 Diplomat Place
- 2331 Eveningview Dr
- 2058 Olive Bark Cove
- 2050 Olive Bark Cove
- 5744 N Lake Oaks Dr
- 5577 Falling Bark Dr
- 5616 Falling Bark Dr
- 6085 Ivanhoe Rd
- 2623 Surrey Wood Dr
- 5595 Raleigh Lagrange Rd
- 6016 Ivawood Dr
- 6188 Ashton Rd Unit 13
- 6192 Ashton Rd Unit 15
- 6196 Ashton Rd Unit 16
- 6195 Summer Hills Cir Unit 18
- 6195 Summer Hills Cir Unit 17A
- 6195 Summer Hills Cir
- 6200 Ashton Rd Unit 25
- 6197 Summer Hills Cir
- 6197 Summer Hills Cir Unit A
- 6190 Summer Hills Cir Unit 1
- 6190 Summer Hills Cir
- 6202 Ashton Rd Unit 26
- 6192 Summer Hills Cir
- 6204 Ashton Rd Unit 27
- 6194 Summer Hills Cir Unit 3
- 6196 Summer Hills Cir Unit 4
- 6206 Ashton Rd Unit 28
- 6199 Summer Hills Cir Unit 6199A
- 6199 Summer Hills Cir Unit 21
- 6199 Summer Hills Cir