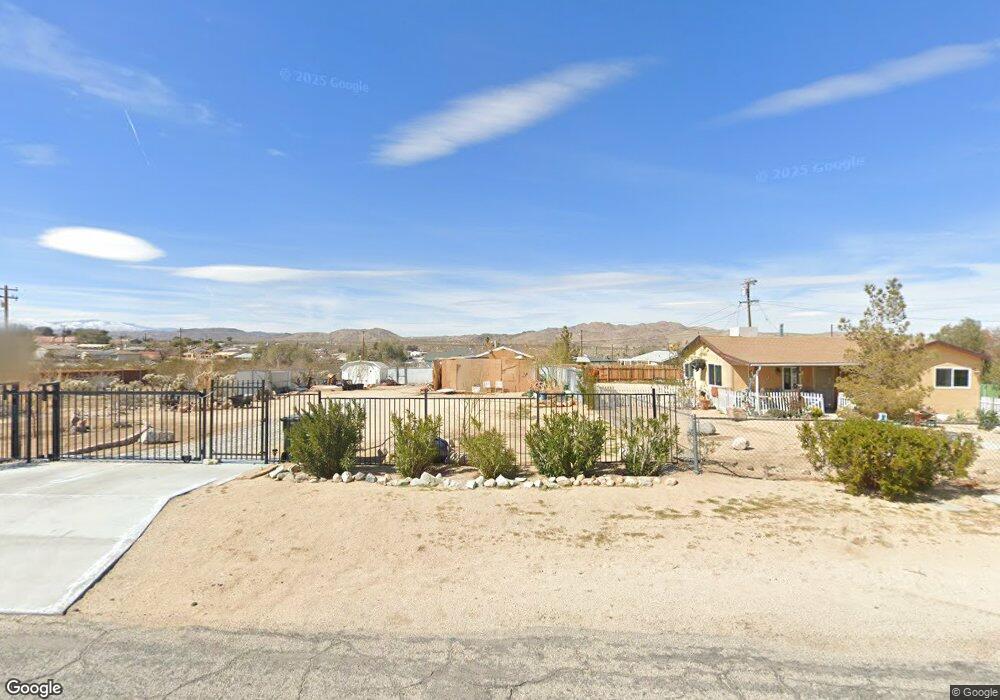
61948 Sunburst Cir Joshua Tree, CA 92252
Estimated Value: $174,000 - $359,000
1
Bed
1
Bath
784
Sq Ft
$334/Sq Ft
Est. Value
About This Home
This home is located at 61948 Sunburst Cir, Joshua Tree, CA 92252 and is currently estimated at $261,656, approximately $333 per square foot. 61948 Sunburst Cir is a home located in San Bernardino County with nearby schools including Joshua Tree Elementary School, La Contenta Middle School, and Yucca Valley High School.
Ownership History
Date
Name
Owned For
Owner Type
Purchase Details
Closed on
Jan 19, 2021
Sold by
Lamproe Jean
Bought by
Chandler Brian and Chandler Diana
Current Estimated Value
Home Financials for this Owner
Home Financials are based on the most recent Mortgage that was taken out on this home.
Original Mortgage
$48,600
Outstanding Balance
$42,785
Interest Rate
2.6%
Mortgage Type
Commercial
Estimated Equity
$218,871
Purchase Details
Closed on
Mar 9, 2011
Sold by
Lamproe Leonard
Bought by
Lamproe Leonard and Lamproe Jean
Purchase Details
Closed on
Jan 20, 2010
Sold by
Kerber Annette
Bought by
Lamproe Leonard
Purchase Details
Closed on
Nov 8, 2007
Sold by
Krygier Colleen
Bought by
Townsend Linnie E and Townsend Linnie Edna
Purchase Details
Closed on
May 8, 1999
Sold by
Townsend Linnie E
Bought by
Townsend Linnie Edna and Linie Edna Townsend Revocable
Create a Home Valuation Report for This Property
The Home Valuation Report is an in-depth analysis detailing your home's value as well as a comparison with similar homes in the area
Home Values in the Area
Average Home Value in this Area
Purchase History
| Date | Buyer | Sale Price | Title Company |
|---|---|---|---|
| Chandler Brian | $60,000 | Wfg National Title Co Of Ca | |
| Lamproe Leonard | -- | None Available | |
| Lamproe Leonard | $35,000 | Orange Coast Title Company | |
| Townsend Linnie E | -- | None Available | |
| Townsend Linnie Edna | -- | -- |
Source: Public Records
Mortgage History
| Date | Status | Borrower | Loan Amount |
|---|---|---|---|
| Open | Chandler Brian | $48,600 |
Source: Public Records
Tax History
| Year | Tax Paid | Tax Assessment Tax Assessment Total Assessment is a certain percentage of the fair market value that is determined by local assessors to be the total taxable value of land and additions on the property. | Land | Improvement |
|---|---|---|---|---|
| 2025 | $2,284 | $132,400 | $50,900 | $81,500 |
| 2024 | $1,917 | $137,957 | $53,060 | $84,897 |
| 2023 | $1,881 | $135,252 | $52,020 | $83,232 |
| 2022 | $1,844 | $132,600 | $51,000 | $81,600 |
| 2021 | $786 | $41,739 | $4,174 | $37,565 |
| 2020 | $778 | $41,311 | $4,131 | $37,180 |
| 2019 | $807 | $40,501 | $4,050 | $36,451 |
| 2018 | $643 | $39,707 | $3,971 | $35,736 |
| 2017 | $638 | $38,928 | $3,893 | $35,035 |
| 2016 | $629 | $38,165 | $3,817 | $34,348 |
| 2015 | $599 | $37,592 | $3,760 | $33,832 |
| 2014 | $623 | $36,855 | $3,686 | $33,169 |
Source: Public Records
Map
Nearby Homes
- 61879 Valley View Cir
- 62070 Easterly Place
- 61981 Sunburst Cir
- 61855 Valley View Cir
- 6935 Alturas Dr
- 61869 Grand View Cir
- 61956 Mountain View Cir
- 61853 Grand View Cir
- 61891 El Reposo Cir
- 6967 Park Blvd
- 61975 Sunburst Cir
- 61936 El Reposo Cir
- 6990 Park Blvd
- 61998 El Reposo Cir
- 16890 El Reposo Cir
- 62016 Valley View Cir
- 62137 Desert Air Rd
- 62004 Sunburst Cir
- 62147 Desert Air Rd
- 61773 Crest Circle Dr
- 61950 Sunburst Cir
- 61935 Mountain View Cir
- 61944 Sunburst Cir
- 61937 Mountain View Cir
- 61952 Sunburst Cir
- 61931 Mountain View Cir
- 61939 Mountain View Cir
- 6850 Easterly Dr
- 61943 Sunburst Cir
- 62010 Easterly Place
- 61884 Mountain View Cir
- 62015 Easterly Place
- 61936 Sunburst Cir
- 0 East Pkwy Unit DC12010499
- 0 East Pkwy Unit 17-268590PS
- 0 East Pkwy Unit CRJT23211794
- 0 East Pkwy Unit JT23211794
- 0 East Pkwy Unit 219090466PS
- 0 East Pkwy Unit 219090465PS
- 0 East Pkwy Unit IV20094397
Your Personal Tour Guide
Ask me questions while you tour the home.