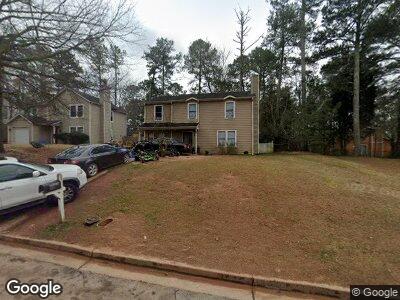
6195 Creekford Ln Lithonia, GA 30058
Estimated Value: $216,907 - $227,000
4
Beds
3
Baths
1,590
Sq Ft
$140/Sq Ft
Est. Value
About This Home
This home is located at 6195 Creekford Ln, Lithonia, GA 30058 and is currently estimated at $222,227, approximately $139 per square foot. 6195 Creekford Ln is a home located in DeKalb County with nearby schools including Panola Way Elementary School, Lithonia Middle School, and Lithonia High School.
Ownership History
Date
Name
Owned For
Owner Type
Purchase Details
Closed on
Jan 20, 2011
Sold by
Federal Home Loan Mortgage Corporation
Bought by
Howie Mona and Howie Alexander
Current Estimated Value
Purchase Details
Closed on
Oct 5, 2010
Sold by
Wells Fargo Bk Na
Bought by
Federal Home Loan Mortgage Corporation
Purchase Details
Closed on
Aug 11, 2010
Sold by
Ghannam Holdings Llc
Bought by
Ghannam Ramah A
Purchase Details
Closed on
May 8, 2008
Sold by
Ghannam Ramah A
Bought by
Ghannam Holdings Llc
Purchase Details
Closed on
Sep 29, 2003
Sold by
Hud
Bought by
Ghannam Ramah A
Home Financials for this Owner
Home Financials are based on the most recent Mortgage that was taken out on this home.
Original Mortgage
$83,900
Interest Rate
6.32%
Mortgage Type
Stand Alone Second
Purchase Details
Closed on
Aug 6, 2002
Sold by
Mers
Bought by
Hud
Create a Home Valuation Report for This Property
The Home Valuation Report is an in-depth analysis detailing your home's value as well as a comparison with similar homes in the area
Home Values in the Area
Average Home Value in this Area
Purchase History
| Date | Buyer | Sale Price | Title Company |
|---|---|---|---|
| Howie Mona | -- | -- | |
| Federal Home Loan Mortgage Corporation | -- | -- | |
| Wells Fargo Bk Na | $28,900 | -- | |
| Ghannam Ramah A | -- | -- | |
| Ghannam Holdings Llc | -- | -- | |
| Ghannam Ramah A | -- | -- | |
| Hud | -- | -- | |
| Mers | $76,225 | -- |
Source: Public Records
Mortgage History
| Date | Status | Borrower | Loan Amount |
|---|---|---|---|
| Previous Owner | Ghannam Ramah A | $83,900 |
Source: Public Records
Tax History Compared to Growth
Tax History
| Year | Tax Paid | Tax Assessment Tax Assessment Total Assessment is a certain percentage of the fair market value that is determined by local assessors to be the total taxable value of land and additions on the property. | Land | Improvement |
|---|---|---|---|---|
| 2023 | $3,819 | $86,520 | $15,000 | $71,520 |
| 2022 | $3,635 | $75,680 | $15,000 | $60,680 |
| 2021 | $2,587 | $51,800 | $5,120 | $46,680 |
| 2020 | $2,098 | $40,680 | $5,120 | $35,560 |
| 2019 | $1,763 | $33,040 | $5,120 | $27,920 |
| 2018 | $1,559 | $30,560 | $5,120 | $25,440 |
| 2017 | $1,308 | $22,560 | $5,120 | $17,440 |
| 2016 | $1,478 | $26,360 | $5,120 | $21,240 |
| 2014 | $1,552 | $27,360 | $5,120 | $22,240 |
Source: Public Records
Map
Nearby Homes
- 6218 Creekford Ln
- 6235 Creekford Ln
- 2254 Wellington Cir
- 6231 Creekford Dr
- 6066 Creekford Dr
- 2320 Cherokee Valley Dr Unit 4
- 2261 Wellington Cir
- 2220 Wellington Cir
- 2173 Wellington Cir
- 2190 Wellington Cir
- 2248 Anne's Lake Cir
- 2341 Wellington Cir
- 2391 Cove Rd
- 6826 Covington Hwy
- 6179 Dana Ct
- 2353 Wellington Cir
- 6300 Creekford Dr
- 6195 Creekford Ln
- 6199 Creekford Ln
- 6199 Creekford Ln
- 6156 Creekford Dr
- 6168 Creekford Dr
- 6205 Creekford Ln
- 6192 Creekford Dr
- 6188 Creekford Dr
- 6198 Creekford Dr
- 6176 Creekford Dr
- 6194 Creekford Ln
- 6198 Creekford Ln Unit 4
- 6209 Creekford Ln
- 6202 Creekford Dr
- 6188 Creekford Ln
- 6204 Creekford Ln
- 6208 Creekford Ln
- 6215 Creekford Ln
- 6161 Creekford Dr Unit 2
- 6165 Creekford Dr