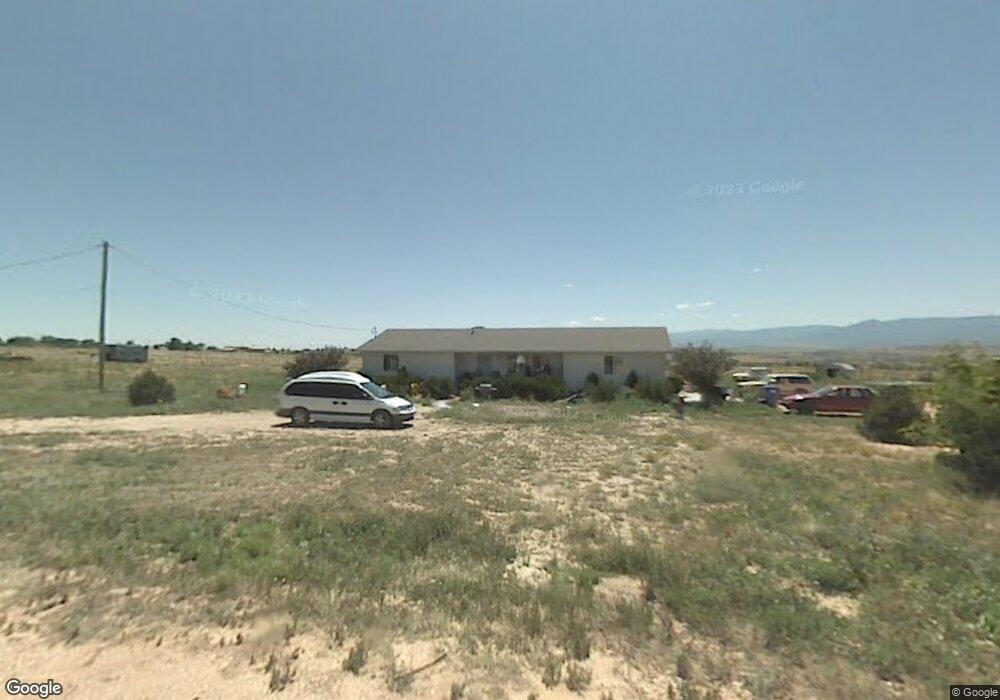
62 9th Ave Penrose, CO 81240
Estimated Value: $376,000 - $412,000
3
Beds
2
Baths
1,713
Sq Ft
$228/Sq Ft
Est. Value
About This Home
This home is located at 62 9th Ave, Penrose, CO 81240 and is currently estimated at $390,580, approximately $228 per square foot. 62 9th Ave is a home located in Fremont County with nearby schools including Penrose Elementary School and Florence High School.
Ownership History
Date
Name
Owned For
Owner Type
Purchase Details
Closed on
Apr 22, 2022
Sold by
Lallemand Justin A
Bought by
Goodrich Lia Alexis and Muncy Kenneth Lee
Current Estimated Value
Home Financials for this Owner
Home Financials are based on the most recent Mortgage that was taken out on this home.
Original Mortgage
$267,750
Outstanding Balance
$248,145
Interest Rate
3.85%
Mortgage Type
New Conventional
Estimated Equity
$142,435
Purchase Details
Closed on
Feb 11, 2019
Sold by
Lallemand Justin A and Lallemand Maggie N
Bought by
Lallemand Justin A and Lallemand Maggie N
Home Financials for this Owner
Home Financials are based on the most recent Mortgage that was taken out on this home.
Original Mortgage
$162,800
Interest Rate
5.62%
Mortgage Type
FHA
Purchase Details
Closed on
May 8, 2009
Sold by
Carroll John F and Javernick Steven A
Bought by
Lallemand Justin A and Schwindt Maggie N
Home Financials for this Owner
Home Financials are based on the most recent Mortgage that was taken out on this home.
Original Mortgage
$132,551
Interest Rate
5.19%
Mortgage Type
New Conventional
Purchase Details
Closed on
Mar 4, 2009
Sold by
Us Bank National Association
Bought by
Carroll John F
Purchase Details
Closed on
Sep 15, 2008
Sold by
Davis Gregory L
Bought by
Us Bank National Assciation
Create a Home Valuation Report for This Property
The Home Valuation Report is an in-depth analysis detailing your home's value as well as a comparison with similar homes in the area
Home Values in the Area
Average Home Value in this Area
Purchase History
| Date | Buyer | Sale Price | Title Company |
|---|---|---|---|
| Goodrich Lia Alexis | $377,000 | Stewart Title Company | |
| Lallemand Justin A | -- | None Available | |
| Lallemand Justin A | $129,900 | None Available | |
| Carroll John F | $103,000 | None Available | |
| Us Bank National Assciation | -- | None Available |
Source: Public Records
Mortgage History
| Date | Status | Borrower | Loan Amount |
|---|---|---|---|
| Open | Goodrich Lia Alexis | $267,750 | |
| Previous Owner | Lallemand Justin A | $162,800 | |
| Previous Owner | Lallemand Justin A | $132,551 |
Source: Public Records
Tax History
| Year | Tax Paid | Tax Assessment Tax Assessment Total Assessment is a certain percentage of the fair market value that is determined by local assessors to be the total taxable value of land and additions on the property. | Land | Improvement |
|---|---|---|---|---|
| 2025 | $1,668 | $22,550 | -- | -- |
| 2024 | $1,668 | $24,055 | $0 | $0 |
| 2023 | $1,441 | $16,903 | $0 | $0 |
| 2022 | $1,243 | $17,163 | $0 | $0 |
| 2021 | $1,258 | $17,657 | $0 | $0 |
| 2020 | $913 | $14,982 | $0 | $0 |
| 2019 | $917 | $14,982 | $0 | $0 |
| 2018 | $752 | $12,311 | $0 | $0 |
| 2017 | $754 | $12,311 | $0 | $0 |
| 2016 | $817 | $13,350 | $0 | $0 |
| 2015 | $807 | $13,350 | $0 | $0 |
| 2012 | $884 | $13,480 | $3,980 | $9,500 |
Source: Public Records
Map
Nearby Homes
Your Personal Tour Guide
Ask me questions while you tour the home.