Estimated Value: $544,873 - $621,000
4
Beds
2
Baths
1,872
Sq Ft
$314/Sq Ft
Est. Value
About This Home
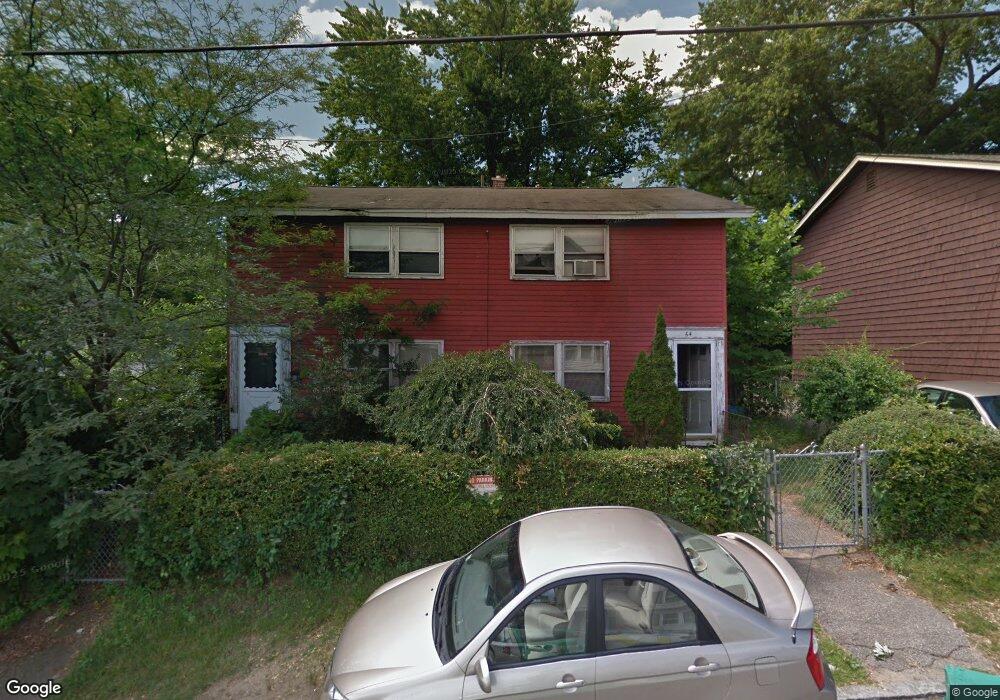
This home is located at 62 B St, Lowell, MA 01851 and is currently estimated at $587,218, approximately $313 per square foot. 62 B St is a home located in Middlesex County with nearby schools including Abraham Lincoln Elementary School, Charles W. Morey Elementary School, and Dr. Gertrude Bailey Elementary School.
Ownership History
Date
Name
Owned For
Owner Type
Purchase Details
Closed on
Feb 20, 2015
Sold by
Holland Virginia J Est
Bought by
Aing Kimna
Current Estimated Value
Purchase Details
Closed on
Dec 31, 1990
Sold by
Collins Frederick P
Bought by
Holland Virginia J
Home Financials for this Owner
Home Financials are based on the most recent Mortgage that was taken out on this home.
Original Mortgage
$109,250
Interest Rate
9.96%
Mortgage Type
Purchase Money Mortgage
Create a Home Valuation Report for This Property
The Home Valuation Report is an in-depth analysis detailing your home's value as well as a comparison with similar homes in the area
Home Values in the Area
Average Home Value in this Area
Purchase History
| Date | Buyer | Sale Price | Title Company |
|---|---|---|---|
| Aing Kimna | $150,000 | -- | |
| Holland Virginia J | $115,000 | -- | |
| Holland Virginia J | $115,000 | -- |
Source: Public Records
Mortgage History
| Date | Status | Borrower | Loan Amount |
|---|---|---|---|
| Previous Owner | Holland Virginia J | $109,250 |
Source: Public Records
Tax History
| Year | Tax Paid | Tax Assessment Tax Assessment Total Assessment is a certain percentage of the fair market value that is determined by local assessors to be the total taxable value of land and additions on the property. | Land | Improvement |
|---|---|---|---|---|
| 2025 | $5,349 | $465,900 | $148,600 | $317,300 |
| 2024 | $4,824 | $405,000 | $133,700 | $271,300 |
| 2023 | $4,577 | $368,500 | $116,300 | $252,200 |
| 2022 | $4,039 | $318,300 | $105,700 | $212,600 |
| 2021 | $3,999 | $297,100 | $91,900 | $205,200 |
| 2020 | $3,583 | $268,200 | $80,300 | $187,900 |
| 2019 | $3,482 | $248,000 | $74,400 | $173,600 |
| 2018 | $3,254 | $226,100 | $67,700 | $158,400 |
| 2017 | $3,214 | $215,400 | $61,500 | $153,900 |
| 2016 | $3,106 | $204,900 | $58,600 | $146,300 |
| 2015 | $2,960 | $191,200 | $60,000 | $131,200 |
| 2013 | $2,912 | $194,000 | $71,700 | $122,300 |
Source: Public Records
Map
Nearby Homes
Your Personal Tour Guide
Ask me questions while you tour the home.