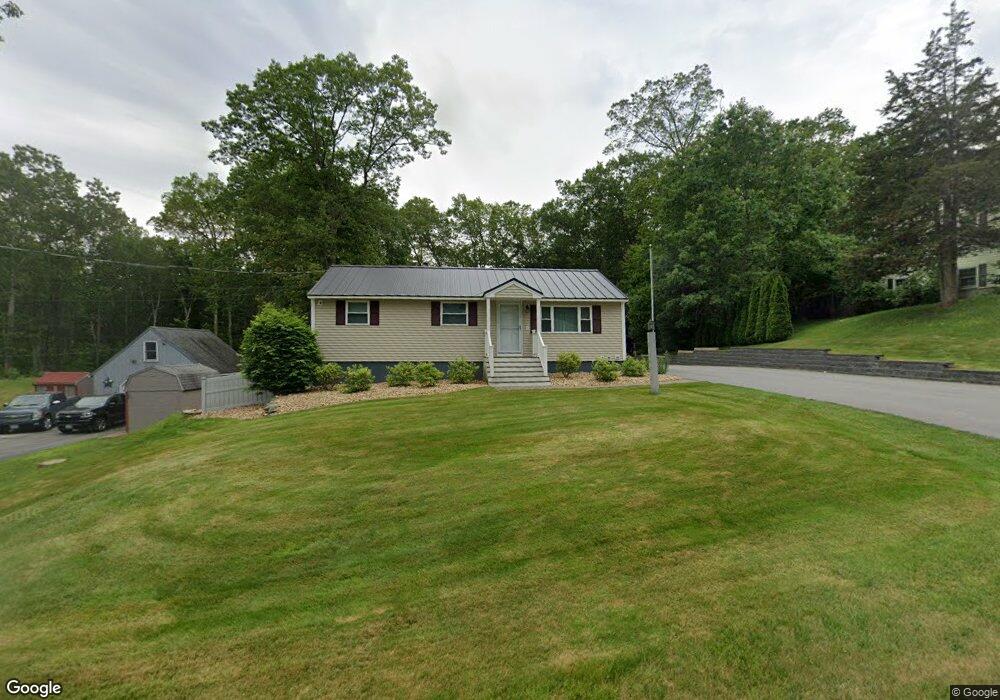
62 Belmont Dr Merrimack, NH 03054
Estimated Value: $460,000 - $510,000
3
Beds
1
Bath
1,360
Sq Ft
$353/Sq Ft
Est. Value
About This Home
This home is located at 62 Belmont Dr, Merrimack, NH 03054 and is currently estimated at $480,542, approximately $353 per square foot. 62 Belmont Dr is a home located in Hillsborough County with nearby schools including Reeds Ferry School, James Mastricola Upper Elementary School, and Merrimack Middle School.
Ownership History
Date
Name
Owned For
Owner Type
Purchase Details
Closed on
Nov 22, 2017
Sold by
Andrick John W
Bought by
John W Andrick Ret
Current Estimated Value
Purchase Details
Closed on
Oct 1, 2014
Sold by
Archambault Keith M and Archambault Jayme L
Bought by
Andrick John
Purchase Details
Closed on
Jan 15, 2009
Sold by
Kittle Larry
Bought by
Archambault Keith M and Archambault Jayme L
Home Financials for this Owner
Home Financials are based on the most recent Mortgage that was taken out on this home.
Original Mortgage
$197,395
Interest Rate
5.52%
Mortgage Type
Purchase Money Mortgage
Purchase Details
Closed on
Jan 7, 2008
Sold by
Mansfield Dana O and Mansfield Patricia M
Bought by
Kittle Larry W
Create a Home Valuation Report for This Property
The Home Valuation Report is an in-depth analysis detailing your home's value as well as a comparison with similar homes in the area
Home Values in the Area
Average Home Value in this Area
Purchase History
| Date | Buyer | Sale Price | Title Company |
|---|---|---|---|
| John W Andrick Ret | -- | -- | |
| John W Andrick Ret | -- | -- | |
| Andrick John | $235,000 | -- | |
| Andrick John | $235,000 | -- | |
| Archambault Keith M | $200,000 | -- | |
| Archambault Keith M | $200,000 | -- | |
| Kittle Larry W | $113,000 | -- | |
| Kittle Larry W | $113,000 | -- |
Source: Public Records
Mortgage History
| Date | Status | Borrower | Loan Amount |
|---|---|---|---|
| Previous Owner | Kittle Larry W | $203,550 | |
| Previous Owner | Kittle Larry W | $197,395 |
Source: Public Records
Tax History Compared to Growth
Tax History
| Year | Tax Paid | Tax Assessment Tax Assessment Total Assessment is a certain percentage of the fair market value that is determined by local assessors to be the total taxable value of land and additions on the property. | Land | Improvement |
|---|---|---|---|---|
| 2024 | $7,709 | $372,600 | $194,700 | $177,900 |
| 2023 | $7,247 | $372,600 | $194,700 | $177,900 |
| 2022 | $6,476 | $372,600 | $194,700 | $177,900 |
| 2021 | $6,398 | $372,600 | $194,700 | $177,900 |
| 2020 | $6,284 | $261,200 | $134,900 | $126,300 |
| 2019 | $5,941 | $246,200 | $134,900 | $111,300 |
| 2018 | $5,876 | $243,600 | $134,900 | $108,700 |
| 2017 | $5,693 | $243,600 | $134,900 | $108,700 |
| 2016 | $5,552 | $243,600 | $134,900 | $108,700 |
| 2015 | $5,337 | $215,900 | $123,200 | $92,700 |
| 2014 | $5,201 | $215,900 | $123,200 | $92,700 |
| 2013 | $5,162 | $215,900 | $123,200 | $92,700 |
Source: Public Records
Map
Nearby Homes
- 29 Bedford Rd
- 22 Kimberly Dr
- 5 Barbie Ct
- 1 Pleasant St
- 19 Vista Way
- 38 Mallard Point
- 9 Mustang Dr Unit C
- 9 Mustang Dr Unit B
- 7 Mustang Dr Unit C
- 7 Mustang Dr Unit END UNIT-A
- 490 Charles Bancroft Hwy
- 10 Kingston Ct Unit 10
- 11 Essex Green Ct
- 22 Essex Green Ct
- 12 Clinton Ct
- 18 Horizon Dr
- 3-C Mustang Dr Unit MODEL
- 22 Clay St
- 8 Donovan Ct
- 769 Daniel Webster Hwy