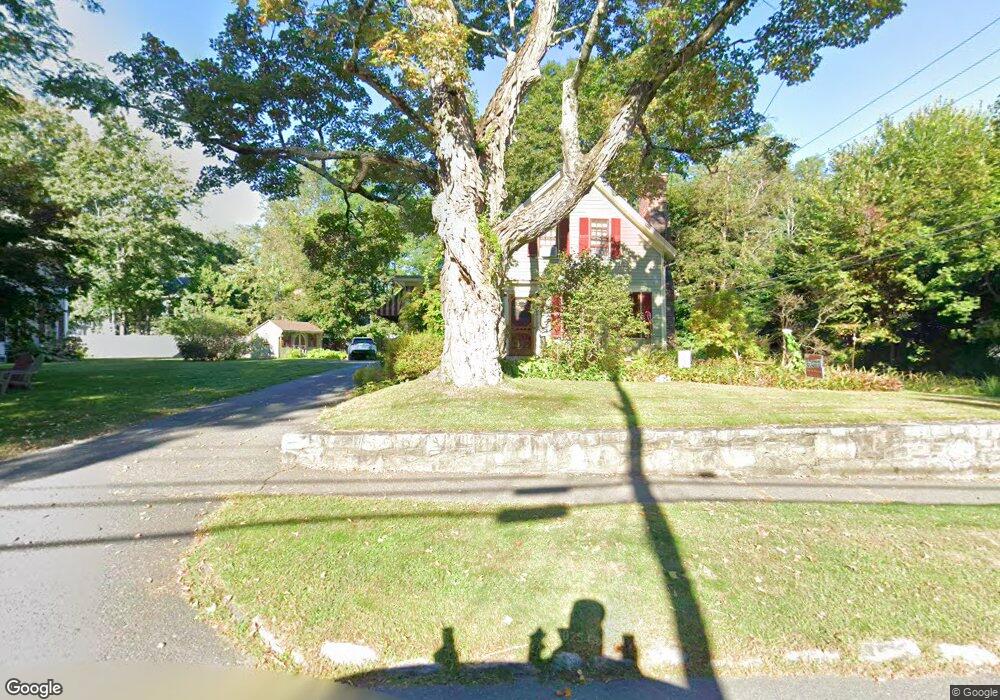
62 Chestnut St Unit 9 Northampton, MA 01062
Florence NeighborhoodEstimated Value: $658,000 - $685,000
4
Beds
4
Baths
2,000
Sq Ft
$333/Sq Ft
Est. Value
About This Home
This home is located at 62 Chestnut St Unit 9, Northampton, MA 01062 and is currently estimated at $666,349, approximately $333 per square foot. 62 Chestnut St Unit 9 is a home located in Hampshire County with nearby schools including Northampton High School, The Montessori School of Northampton, and Lander Grinspoon Academy.
Ownership History
Date
Name
Owned For
Owner Type
Purchase Details
Closed on
Mar 29, 2002
Sold by
Dellapenna Craig P and Dellapenna Griffin-Dellapenna K
Bought by
Zieminski John H
Current Estimated Value
Purchase Details
Closed on
Sep 4, 2001
Sold by
Bandouveres Paula R
Bought by
Dellapenna Craig P and Dellapenna Kathleen A
Purchase Details
Closed on
Aug 13, 1999
Sold by
Mott Stella M
Bought by
Zieminski John H
Purchase Details
Closed on
Jun 16, 1997
Sold by
Boyle James F and Boyle Patricia A
Bought by
Zieminski John H
Purchase Details
Closed on
Feb 28, 1996
Sold by
Towne Evelyn M and Towne Theodore D
Bought by
Zieminski John H
Purchase Details
Closed on
Oct 13, 1995
Sold by
Kirby Eileen M and Kirby Margaret M
Bought by
Zieminski John H
Create a Home Valuation Report for This Property
The Home Valuation Report is an in-depth analysis detailing your home's value as well as a comparison with similar homes in the area
Home Values in the Area
Average Home Value in this Area
Purchase History
| Date | Buyer | Sale Price | Title Company |
|---|---|---|---|
| Zieminski John H | $65,000 | -- | |
| Dellapenna Craig P | $172,500 | -- | |
| Zieminski John H | $60,000 | -- | |
| Zieminski John H | $68,500 | -- | |
| Zieminski John H | $525,000 | -- | |
| Zieminski John H | $33,000 | -- |
Source: Public Records
Mortgage History
| Date | Status | Borrower | Loan Amount |
|---|---|---|---|
| Open | Zieminski John H | $178,000 | |
| Closed | Zieminski John H | $100,000 |
Source: Public Records
Tax History
| Year | Tax Paid | Tax Assessment Tax Assessment Total Assessment is a certain percentage of the fair market value that is determined by local assessors to be the total taxable value of land and additions on the property. | Land | Improvement |
|---|---|---|---|---|
| 2025 | $8,751 | $628,200 | $170,500 | $457,700 |
| 2024 | $9,166 | $603,400 | $148,800 | $454,600 |
| 2023 | $7,689 | $485,400 | $135,200 | $350,200 |
| 2022 | $6,843 | $382,500 | $126,400 | $256,100 |
| 2021 | $5,637 | $324,500 | $120,400 | $204,100 |
| 2020 | $5,452 | $324,500 | $120,400 | $204,100 |
| 2019 | $5,178 | $298,100 | $120,400 | $177,700 |
| 2018 | $5,134 | $301,300 | $120,400 | $180,900 |
| 2017 | $5,029 | $301,300 | $120,400 | $180,900 |
| 2016 | $4,869 | $301,300 | $120,400 | $180,900 |
| 2015 | $4,749 | $300,600 | $130,400 | $170,200 |
| 2014 | $4,626 | $300,600 | $130,400 | $170,200 |
Source: Public Records
Map
Nearby Homes
- 32 Stilson Ave
- 44 Sheffield Ln
- 76 Maple St
- 14 Meadow St
- 67 Park St Unit A
- 33 Landy Ave
- 37 Landy Ave
- 575 Bridge Rd Unit 11-8
- 575 Bridge Rd Unit 12-7
- 575 Bridge Rd Unit 10-5
- 2 Juniper Place
- 0 Terrace Ln
- 63 Riverside Dr
- 42 Clark St
- 289 Hatfield St
- 61 Woodlawn Ave
- 88 Pines Edge Dr Unit 88
- 296 Ryan Rd
- 61 Harrison Ave
- 63 Dryads Green
- 62 Chestnut St
- 62 Chestnut St
- 62-B Chestnut St
- 58 Chestnut St
- 23 Wilder Place
- 66 Chestnut St
- 19 Wilder Place
- 50 Chestnut St Unit 2
- 50 Chestnut St
- 70 Chestnut St
- 57 Chestnut St
- 15 Wilder Place
- 53 Chestnut St
- 24 Wilder Place
- 51 Chestnut St
- 67 Chestnut St
- 67 Chestnut St
- 11 Wilder Place
- 20 Wilder Place
- 78 Chestnut St
Your Personal Tour Guide
Ask me questions while you tour the home.