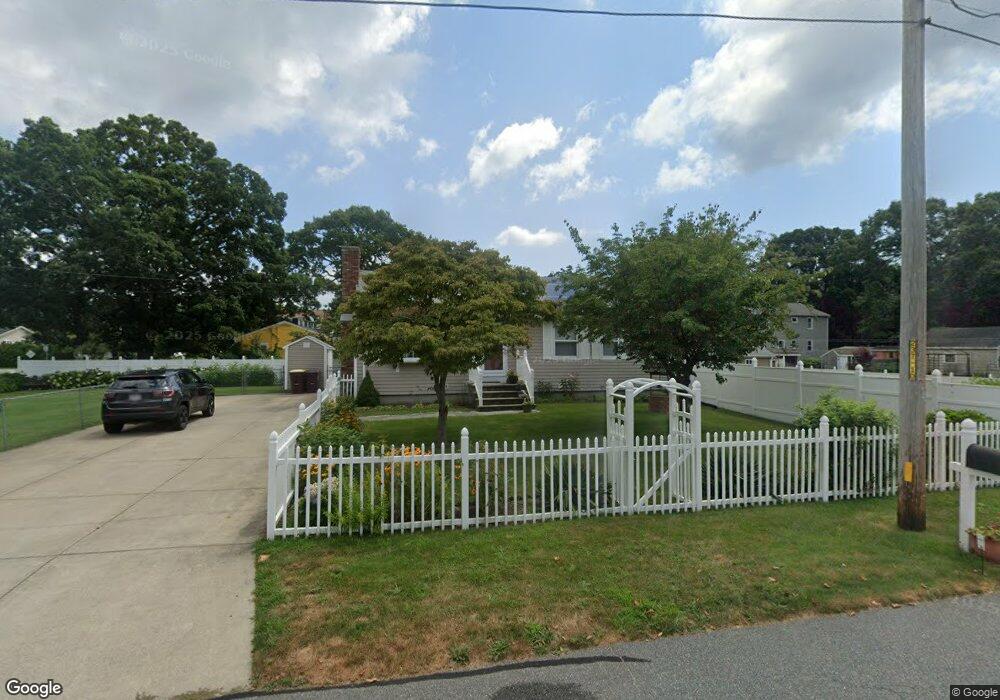
62 Coulombe St Acushnet, MA 02743
Estimated Value: $422,000 - $480,000
3
Beds
1
Bath
1,008
Sq Ft
$446/Sq Ft
Est. Value
About This Home
This home is located at 62 Coulombe St, Acushnet, MA 02743 and is currently estimated at $449,795, approximately $446 per square foot. 62 Coulombe St is a home located in Bristol County with nearby schools including Acushnet Elementary School, Albert F Ford Middle School, and Alma Del Mar Charter School.
Ownership History
Date
Name
Owned For
Owner Type
Purchase Details
Closed on
Mar 6, 2015
Sold by
Pereira Manuel F and Pereira Maria F
Bought by
Pereira Manuel F and Pereira Maria F
Current Estimated Value
Purchase Details
Closed on
Jul 28, 1988
Sold by
Pacheco Daniel
Bought by
Pereira Manuel F
Home Financials for this Owner
Home Financials are based on the most recent Mortgage that was taken out on this home.
Original Mortgage
$100,000
Interest Rate
10.39%
Mortgage Type
Purchase Money Mortgage
Create a Home Valuation Report for This Property
The Home Valuation Report is an in-depth analysis detailing your home's value as well as a comparison with similar homes in the area
Home Values in the Area
Average Home Value in this Area
Purchase History
| Date | Buyer | Sale Price | Title Company |
|---|---|---|---|
| Pereira Manuel F | -- | -- | |
| Pereira Manuel F | $140,000 | -- |
Source: Public Records
Mortgage History
| Date | Status | Borrower | Loan Amount |
|---|---|---|---|
| Previous Owner | Pereira Manuel F | $39,508 | |
| Previous Owner | Pereira Manuel F | $48,000 | |
| Previous Owner | Pereira Manuel F | $54,000 | |
| Previous Owner | Pereira Manuel F | $100,000 |
Source: Public Records
Tax History Compared to Growth
Tax History
| Year | Tax Paid | Tax Assessment Tax Assessment Total Assessment is a certain percentage of the fair market value that is determined by local assessors to be the total taxable value of land and additions on the property. | Land | Improvement |
|---|---|---|---|---|
| 2025 | $43 | $395,100 | $103,700 | $291,400 |
| 2024 | $3,927 | $344,200 | $99,200 | $245,000 |
| 2023 | $3,809 | $317,400 | $90,200 | $227,200 |
| 2022 | $3,782 | $285,000 | $85,700 | $199,300 |
| 2021 | $3,171 | $258,100 | $85,700 | $172,400 |
| 2020 | $11,454 | $258,100 | $85,700 | $172,400 |
| 2019 | $2,701 | $247,500 | $85,700 | $161,800 |
| 2018 | $10,974 | $234,300 | $85,700 | $148,600 |
| 2017 | $2,407 | $224,900 | $85,700 | $139,200 |
| 2016 | $3,172 | $218,300 | $85,700 | $132,600 |
| 2015 | $2,997 | $209,900 | $85,700 | $124,200 |
Source: Public Records
Map
Nearby Homes