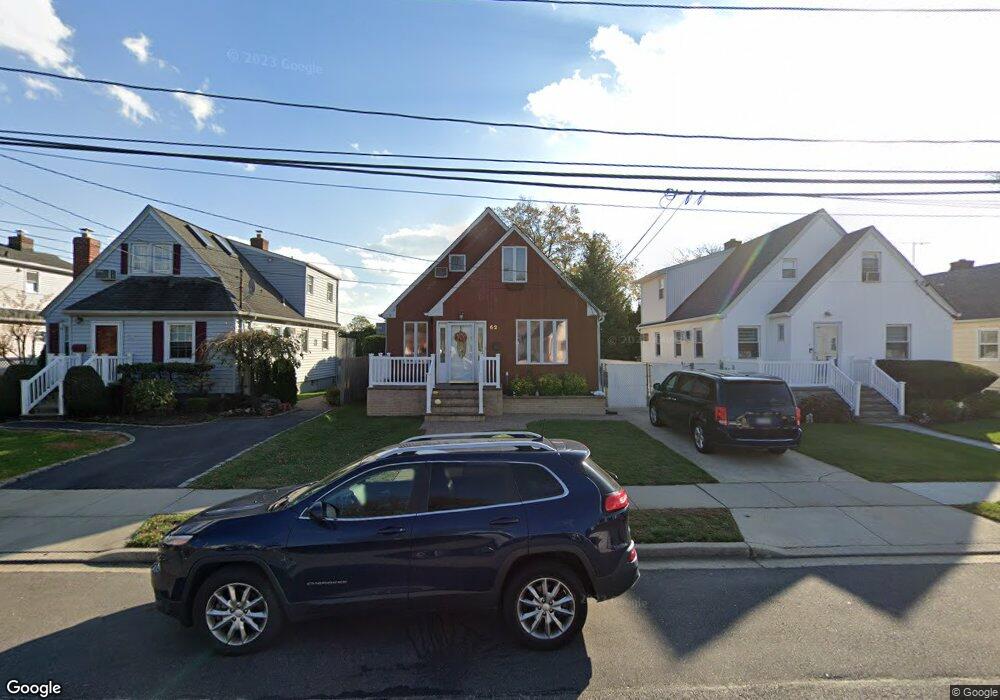
62 Cypress Ave Oceanside, NY 11572
Estimated Value: $663,046 - $763,000
Studio
1
Bath
1,246
Sq Ft
$572/Sq Ft
Est. Value
About This Home
This home is located at 62 Cypress Ave, Oceanside, NY 11572 and is currently estimated at $713,023, approximately $572 per square foot. 62 Cypress Ave is a home located in Nassau County with nearby schools including South Oceanside Road Elementary - School 4, Oceanside Middle School, and Oceanside High School.
Ownership History
Date
Name
Owned For
Owner Type
Purchase Details
Closed on
Mar 23, 2010
Sold by
Spielman Gail
Bought by
Oswald Stephen and Oswald Lisa
Current Estimated Value
Home Financials for this Owner
Home Financials are based on the most recent Mortgage that was taken out on this home.
Original Mortgage
$225,000
Outstanding Balance
$150,165
Interest Rate
5.12%
Mortgage Type
Purchase Money Mortgage
Estimated Equity
$562,858
Purchase Details
Closed on
May 31, 2006
Sold by
Spielman Owen
Purchase Details
Closed on
Jan 24, 2002
Create a Home Valuation Report for This Property
The Home Valuation Report is an in-depth analysis detailing your home's value as well as a comparison with similar homes in the area
Home Values in the Area
Average Home Value in this Area
Purchase History
| Date | Buyer | Sale Price | Title Company |
|---|---|---|---|
| Oswald Stephen | $375,000 | -- | |
| -- | -- | -- | |
| -- | -- | -- |
Source: Public Records
Mortgage History
| Date | Status | Borrower | Loan Amount |
|---|---|---|---|
| Open | Oswald Stephen | $225,000 |
Source: Public Records
Tax History
| Year | Tax Paid | Tax Assessment Tax Assessment Total Assessment is a certain percentage of the fair market value that is determined by local assessors to be the total taxable value of land and additions on the property. | Land | Improvement |
|---|---|---|---|---|
| 2025 | $11,764 | $459 | $168 | $291 |
| 2024 | $3,660 | $459 | $168 | $291 |
Source: Public Records
Map
Nearby Homes
- 3154 Roxbury Rd
- 41 Weidner Ave
- 36 W Windsor Pkwy
- 3348 3rd St
- 3351 4th St
- 3354 2nd St
- 98 Moore Ave
- 3251 Neptune Ave
- 3357 Lawrence Ave
- 3363 Lawrence Ave
- 3373 Lawrence Ave
- 295 Thorn St
- 29 W Henrietta Ave
- 3391 Lawrence Ave
- 2975 Oceanside Rd
- 21 Bellevue Ave
- 3451 3rd St
- 222 Chance Dr
- 66 Virginia Ave
- 163 Mott St
Your Personal Tour Guide
Ask me questions while you tour the home.