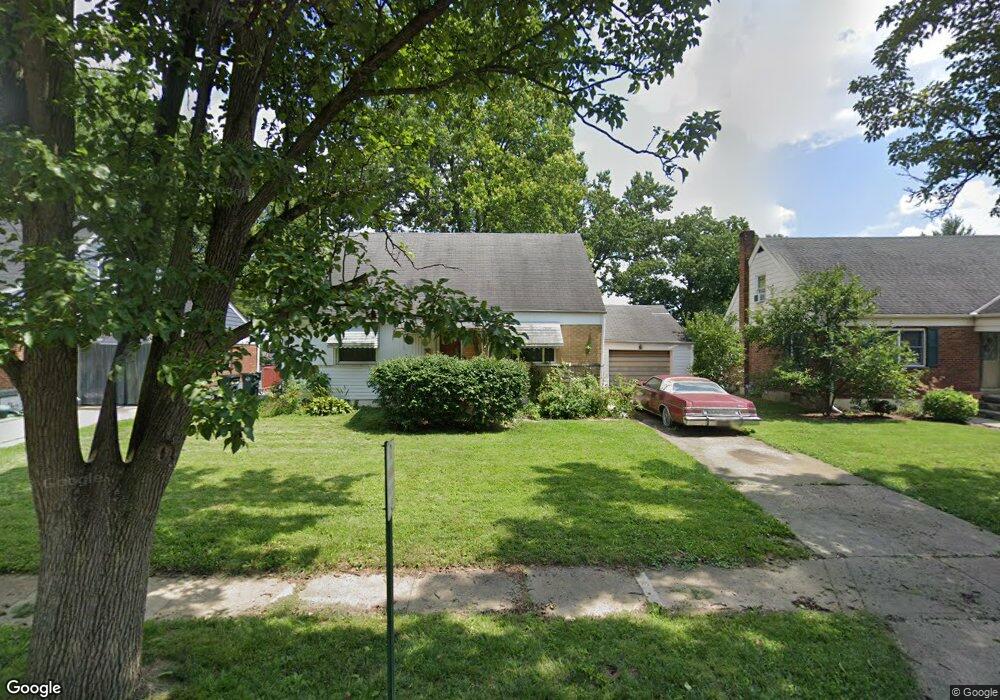
62 Drummond St Cincinnati, OH 45218
Estimated Value: $182,000 - $216,000
2
Beds
1
Bath
884
Sq Ft
$229/Sq Ft
Est. Value
About This Home
This home is located at 62 Drummond St, Cincinnati, OH 45218 and is currently estimated at $202,460, approximately $229 per square foot. 62 Drummond St is a home located in Hamilton County with nearby schools including Central Montessori Academy and John Paul II Catholic School.
Ownership History
Date
Name
Owned For
Owner Type
Purchase Details
Closed on
Jul 29, 2003
Sold by
Litzinger Jeffrey A and Litzinger Annette P
Bought by
Siry Robert B
Current Estimated Value
Home Financials for this Owner
Home Financials are based on the most recent Mortgage that was taken out on this home.
Original Mortgage
$105,000
Outstanding Balance
$50,836
Interest Rate
7.5%
Mortgage Type
Unknown
Estimated Equity
$151,624
Purchase Details
Closed on
Feb 13, 1995
Sold by
Brackett Everett Lee and Litzinger Jeffrey Alan
Bought by
Litzinger Jeffrey Alan
Create a Home Valuation Report for This Property
The Home Valuation Report is an in-depth analysis detailing your home's value as well as a comparison with similar homes in the area
Home Values in the Area
Average Home Value in this Area
Purchase History
| Date | Buyer | Sale Price | Title Company |
|---|---|---|---|
| Siry Robert B | $105,000 | -- | |
| Litzinger Jeffrey Alan | -- | -- |
Source: Public Records
Mortgage History
| Date | Status | Borrower | Loan Amount |
|---|---|---|---|
| Open | Siry Robert B | $105,000 |
Source: Public Records
Tax History
| Year | Tax Paid | Tax Assessment Tax Assessment Total Assessment is a certain percentage of the fair market value that is determined by local assessors to be the total taxable value of land and additions on the property. | Land | Improvement |
|---|---|---|---|---|
| 2025 | $3,922 | $54,125 | $9,412 | $44,713 |
| 2024 | $3,617 | $54,125 | $9,412 | $44,713 |
| 2023 | $3,371 | $54,125 | $9,412 | $44,713 |
| 2022 | $2,924 | $34,997 | $8,169 | $26,828 |
| 2021 | $2,864 | $34,997 | $8,169 | $26,828 |
| 2020 | $2,906 | $34,997 | $8,169 | $26,828 |
| 2019 | $2,825 | $29,912 | $6,983 | $22,929 |
| 2018 | $2,831 | $29,912 | $6,983 | $22,929 |
| 2017 | $2,624 | $29,912 | $6,983 | $22,929 |
| 2016 | $2,913 | $32,480 | $7,644 | $24,836 |
| 2015 | $2,736 | $32,480 | $7,644 | $24,836 |
| 2014 | $2,800 | $32,480 | $7,644 | $24,836 |
| 2013 | $2,990 | $35,693 | $8,400 | $27,293 |
Source: Public Records
Map
Nearby Homes
Your Personal Tour Guide
Ask me questions while you tour the home.