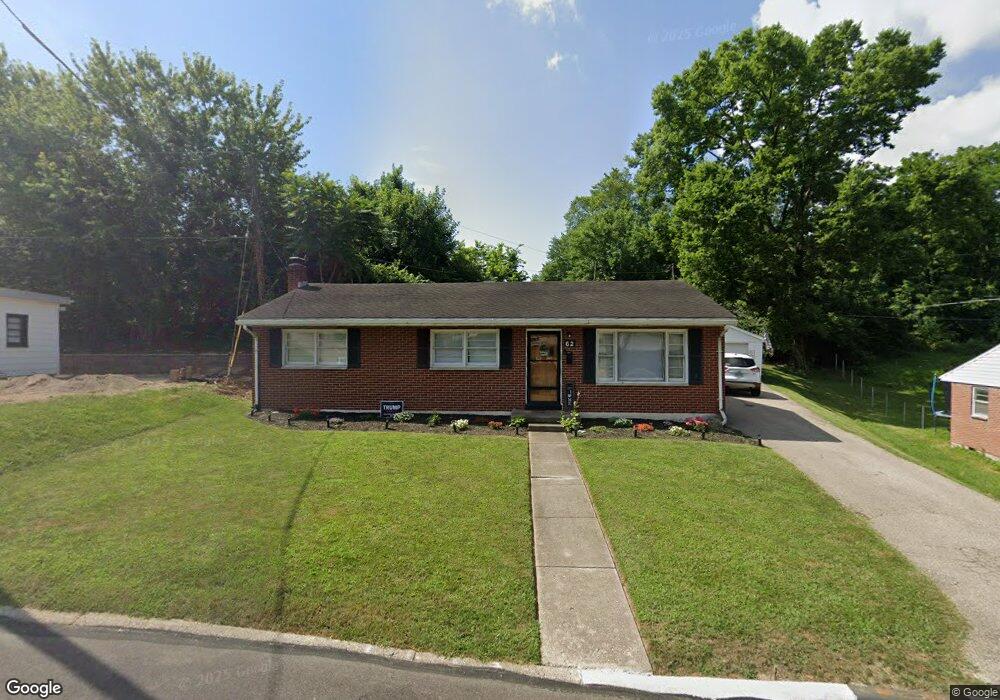
62 E Bryant Ave Franklin, OH 45005
Estimated Value: $199,000 - $232,000
3
Beds
1
Bath
1,144
Sq Ft
$183/Sq Ft
Est. Value
About This Home
This home is located at 62 E Bryant Ave, Franklin, OH 45005 and is currently estimated at $208,981, approximately $182 per square foot. 62 E Bryant Ave is a home located in Warren County with nearby schools including Franklin High School.
Ownership History
Date
Name
Owned For
Owner Type
Purchase Details
Closed on
May 19, 2022
Sold by
Ernst Kimberly L
Bought by
Holt Travis L
Current Estimated Value
Home Financials for this Owner
Home Financials are based on the most recent Mortgage that was taken out on this home.
Original Mortgage
$159,065
Outstanding Balance
$150,054
Interest Rate
5.13%
Mortgage Type
New Conventional
Estimated Equity
$58,927
Purchase Details
Closed on
Feb 1, 2018
Sold by
Harp Judy C
Bought by
Ernst Kimberly L
Purchase Details
Closed on
Feb 13, 2017
Sold by
Harp Judy C
Bought by
Ernst Kimberly L and Ernst E
Purchase Details
Closed on
Sep 28, 1998
Sold by
Harp Elaine
Bought by
Harp Judy C
Purchase Details
Closed on
Sep 20, 1995
Sold by
Dalton Mabel
Bought by
Harp Elaine
Purchase Details
Closed on
Oct 28, 1988
Sold by
Pursley Fred D and Pursley Virgin
Bought by
Dalton and Dalton Mabel B
Create a Home Valuation Report for This Property
The Home Valuation Report is an in-depth analysis detailing your home's value as well as a comparison with similar homes in the area
Home Values in the Area
Average Home Value in this Area
Purchase History
| Date | Buyer | Sale Price | Title Company |
|---|---|---|---|
| Holt Travis L | -- | None Listed On Document | |
| Ernst Kimberly L | -- | -- | |
| Ernst Kimberly L | -- | -- | |
| Harp Judy C | $80,000 | -- | |
| Harp Elaine | $70,000 | -- | |
| Dalton | $52,500 | -- |
Source: Public Records
Mortgage History
| Date | Status | Borrower | Loan Amount |
|---|---|---|---|
| Open | Holt Travis L | $159,065 |
Source: Public Records
Tax History
| Year | Tax Paid | Tax Assessment Tax Assessment Total Assessment is a certain percentage of the fair market value that is determined by local assessors to be the total taxable value of land and additions on the property. | Land | Improvement |
|---|---|---|---|---|
| 2025 | $2,383 | $50,640 | $17,500 | $33,140 |
| 2024 | $2,383 | $50,640 | $17,500 | $33,140 |
| 2023 | $2,109 | $40,211 | $10,762 | $29,449 |
| 2022 | $2,114 | $40,212 | $10,763 | $29,449 |
| 2021 | $2,004 | $40,212 | $10,763 | $29,449 |
| 2020 | $1,847 | $32,694 | $8,750 | $23,944 |
| 2019 | $1,683 | $32,694 | $8,750 | $23,944 |
| 2018 | $1,622 | $32,694 | $8,750 | $23,944 |
| 2017 | $1,553 | $28,203 | $7,648 | $20,556 |
| 2016 | $1,584 | $28,203 | $7,648 | $20,556 |
| 2015 | $1,584 | $28,203 | $7,648 | $20,556 |
| 2014 | $1,624 | $28,200 | $7,650 | $20,560 |
| 2013 | $1,377 | $32,270 | $8,750 | $23,520 |
Source: Public Records
Map
Nearby Homes
- 0 Victoria Dr Unit 942075
- 0 Victoria Dr Unit 1852824
- 228 Bridge St
- 212 Rossman Ct
- 33 Stadia Dr
- 5 S River St
- 551 E 2nd St
- 210 N Riley Blvd
- 657 E 2nd St
- 651 E 2nd St
- 202 E 2nd St
- 413 Spring Ave
- 520 Arlington Ave
- 205 Oxford Rd
- 410 Park Ave
- 605 Spring Ave
- 309 Oxford Rd
- 747 David Blvd
- 0 E 4th St
- 616 Lake Ave
- 52 E Bryant Ave
- 106 E Bryant Ave
- 50 E Bryant Ave
- 405 Victoria Dr
- 42 E Bryant Ave
- 116 E Bryant Ave
- 45 E Bryant Ave
- 410 Victoria Dr
- 34 E Bryant Ave
- 415 Victoria Dr
- 126 E Bryant Ave
- 1 Arlington Dr
- 28 E Bryant Ave
- 29 E Bryant Ave
- 7 Arlington Dr
- 420 Victoria Dr
- 131 E Bryant Ave
- 23 E Bryant Ave
- 0 Victoria Dr Unit 1655312
- 0 Victoria Dr Unit 812708
Your Personal Tour Guide
Ask me questions while you tour the home.