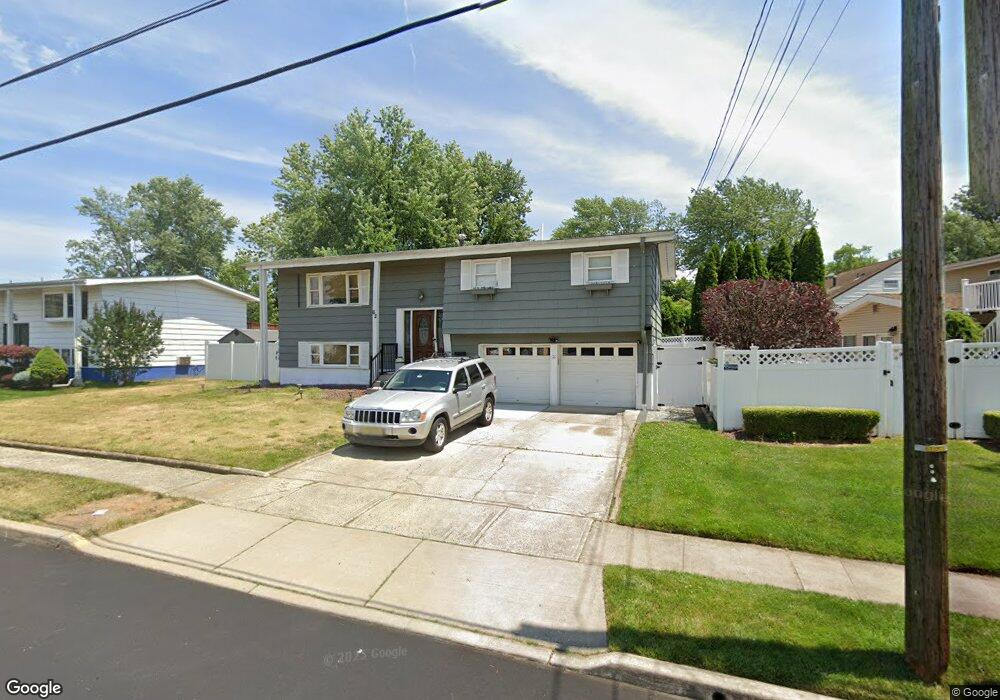
62 Gaub Rd Old Bridge, NJ 08857
Estimated Value: $680,652 - $716,000
4
Beds
3
Baths
2,136
Sq Ft
$326/Sq Ft
Est. Value
About This Home
This home is located at 62 Gaub Rd, Old Bridge, NJ 08857 and is currently estimated at $695,663, approximately $325 per square foot. 62 Gaub Rd is a home located in Middlesex County with nearby schools including Old Bridge High School, St. Ambrose School, and Calvary Christian School.
Ownership History
Date
Name
Owned For
Owner Type
Purchase Details
Closed on
Dec 10, 2018
Sold by
Halal Properties Llc
Bought by
Andrews Justin Michael and Andrews Maria Catherine
Current Estimated Value
Home Financials for this Owner
Home Financials are based on the most recent Mortgage that was taken out on this home.
Original Mortgage
$364,500
Outstanding Balance
$321,132
Interest Rate
4.8%
Mortgage Type
New Conventional
Estimated Equity
$374,531
Purchase Details
Closed on
Dec 14, 2017
Sold by
Ame Fannie
Bought by
Halal Properties
Purchase Details
Closed on
Aug 18, 2017
Sold by
Dunn Michael J and Dunn Cynthia
Bought by
Ditech Financial Llc
Purchase Details
Closed on
Dec 31, 1996
Sold by
Estate Of Henry Festa
Bought by
Dunn Michael
Home Financials for this Owner
Home Financials are based on the most recent Mortgage that was taken out on this home.
Original Mortgage
$130,000
Interest Rate
7.5%
Create a Home Valuation Report for This Property
The Home Valuation Report is an in-depth analysis detailing your home's value as well as a comparison with similar homes in the area
Home Values in the Area
Average Home Value in this Area
Purchase History
| Date | Buyer | Sale Price | Title Company |
|---|---|---|---|
| Andrews Justin Michael | $405,000 | Fidelity Natl Title Ins Co | |
| Halal Properties | $265,001 | None Available | |
| Ditech Financial Llc | -- | None Available | |
| Dunn Michael | $162,500 | -- |
Source: Public Records
Mortgage History
| Date | Status | Borrower | Loan Amount |
|---|---|---|---|
| Open | Andrews Justin Michael | $364,500 | |
| Previous Owner | Dunn Michael | $130,000 |
Source: Public Records
Tax History Compared to Growth
Tax History
| Year | Tax Paid | Tax Assessment Tax Assessment Total Assessment is a certain percentage of the fair market value that is determined by local assessors to be the total taxable value of land and additions on the property. | Land | Improvement |
|---|---|---|---|---|
| 2025 | $9,284 | $164,400 | $64,100 | $100,300 |
| 2024 | $8,906 | $164,400 | $64,100 | $100,300 |
| 2023 | $8,906 | $164,400 | $64,100 | $100,300 |
| 2022 | $8,702 | $164,400 | $64,100 | $100,300 |
| 2021 | $8,550 | $164,400 | $64,100 | $100,300 |
| 2020 | $8,445 | $164,400 | $64,100 | $100,300 |
| 2019 | $8,302 | $164,400 | $64,100 | $100,300 |
| 2018 | $8,105 | $162,300 | $64,100 | $98,200 |
| 2017 | $7,842 | $162,300 | $64,100 | $98,200 |
| 2016 | $7,680 | $162,300 | $64,100 | $98,200 |
| 2015 | $7,547 | $162,300 | $64,100 | $98,200 |
| 2014 | $7,471 | $162,300 | $64,100 | $98,200 |
Source: Public Records
Map
Nearby Homes