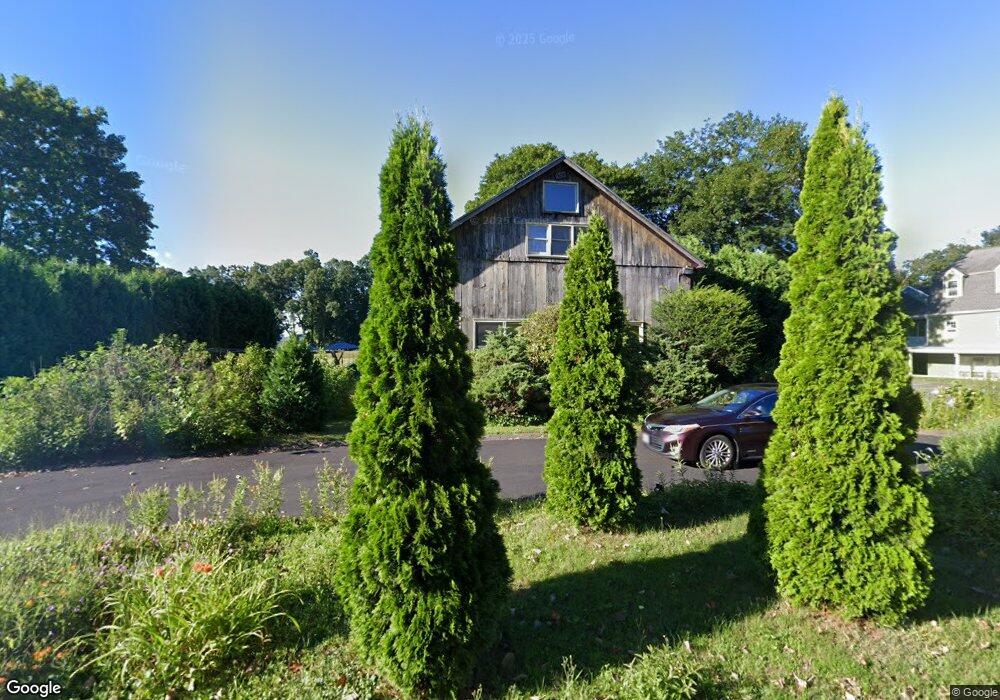
62 Main St Unit 22 Hatfield, MA 01038
Estimated Value: $292,000 - $406,000
2
Beds
1
Bath
1,297
Sq Ft
$262/Sq Ft
Est. Value
About This Home
This home is located at 62 Main St Unit 22, Hatfield, MA 01038 and is currently estimated at $339,616, approximately $261 per square foot. 62 Main St Unit 22 is a home located in Hampshire County with nearby schools including Hatfield Elementary School and Smith Academy.
Ownership History
Date
Name
Owned For
Owner Type
Purchase Details
Closed on
Nov 19, 2021
Sold by
Hartman Elizabeth
Bought by
Mcgrath Laura L
Current Estimated Value
Home Financials for this Owner
Home Financials are based on the most recent Mortgage that was taken out on this home.
Original Mortgage
$216,000
Outstanding Balance
$197,927
Interest Rate
2.99%
Mortgage Type
Purchase Money Mortgage
Estimated Equity
$141,689
Purchase Details
Closed on
May 30, 2007
Sold by
Rilleau Mariana E
Bought by
Hartman Elizabeth
Home Financials for this Owner
Home Financials are based on the most recent Mortgage that was taken out on this home.
Original Mortgage
$160,000
Interest Rate
6.24%
Mortgage Type
Purchase Money Mortgage
Purchase Details
Closed on
Oct 24, 2003
Sold by
Cheser Nancy
Bought by
Rilleau Mariana E
Create a Home Valuation Report for This Property
The Home Valuation Report is an in-depth analysis detailing your home's value as well as a comparison with similar homes in the area
Home Values in the Area
Average Home Value in this Area
Purchase History
We collect this data history from publicly available records. To have your information removed, we recommend requesting removal directly through your county’s website.
| Date | Buyer | Sale Price | Title Company |
|---|---|---|---|
| Mcgrath Laura L | $218,000 | None Available | |
| Hartman Elizabeth | $200,000 | -- | |
| Rilleau Mariana E | $171,000 | -- |
Source: Public Records
Mortgage History
We collect this data history from publicly available records. To have your information removed, we recommend requesting removal directly through your county’s website.
| Date | Status | Borrower | Loan Amount |
|---|---|---|---|
| Open | Mcgrath Laura L | $216,000 | |
| Previous Owner | Hartman Elizabeth | $160,000 |
Source: Public Records
Tax History
| Year | Tax Paid | Tax Assessment Tax Assessment Total Assessment is a certain percentage of the fair market value that is determined by local assessors to be the total taxable value of land and additions on the property. | Land | Improvement |
|---|---|---|---|---|
| 2025 | $3,531 | $255,100 | $0 | $255,100 |
| 2024 | $3,650 | $238,400 | $0 | $238,400 |
| 2023 | $2,901 | $215,200 | $0 | $215,200 |
| 2022 | $2,700 | $197,500 | $0 | $197,500 |
| 2021 | $2,803 | $197,500 | $0 | $197,500 |
| 2020 | $2,672 | $197,500 | $0 | $197,500 |
| 2019 | $2,702 | $194,500 | $0 | $194,500 |
| 2018 | $2,641 | $194,500 | $0 | $194,500 |
| 2017 | $2,390 | $180,800 | $0 | $180,800 |
| 2016 | $2,383 | $180,800 | $0 | $180,800 |
| 2015 | $2,352 | $178,600 | $0 | $178,600 |
| 2014 | $2,281 | $180,000 | $0 | $180,000 |
Source: Public Records
Map
Nearby Homes
- 58 Main St Unit 3
- 136 Main St
- 277 River Dr
- 71 Chestnut St
- 0 Straits Rd
- 26 Gore Ave
- 1 Kozera Ave
- 26 Scotland Rd
- 74 N Hatfield Rd
- 6 Woodlawn Rd
- 9 Meadowbrook Dr
- Lot 1 N Hatfield Rd
- Lot 2 N Hatfield Rd
- 0 N Branch Rd
- 211 Russell St
- 111 West St
- 115 West St
- 73 N Maple St
- 26 Russell St Unit A-B
- 128 West St
- 62 Main St Unit 25
- 62 Main St Unit 24
- 62 Main St Unit 23
- 62 Main St Unit 21
- 62 Main St Unit 20
- 62 Main St Unit 19
- 62 Main St Unit 18
- 62 Main St Unit 17
- 62 Main St Unit 16
- 62 Main St Unit 15
- 62 Main St Unit 14
- 62 Main St Unit 13
- 62 Main St Unit 12
- 62 Main St Unit 11
- 62 Main St Unit 10
- 62 Main St Unit 9
- 62 Main St Unit 26
- 62 Main St Unit 6.5
- 62 Main St Unit 5-7
- 62 Main St Unit 5
Your Personal Tour Guide
Ask me questions while you tour the home.