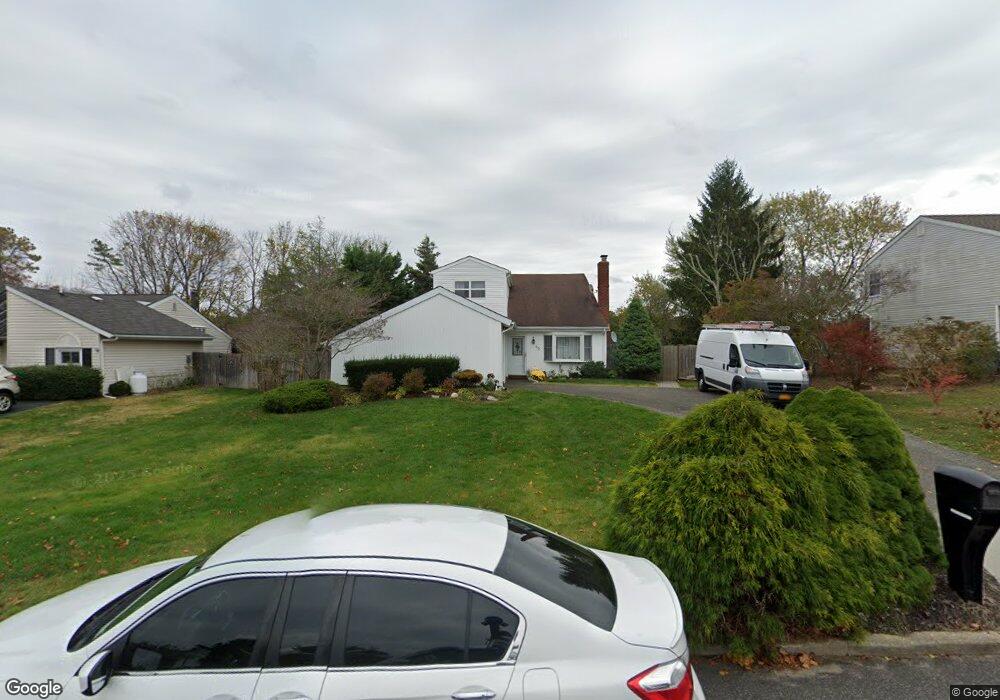
62 Mercury Ave East Patchogue, NY 11772
Estimated Value: $618,000 - $763,000
3
Beds
1
Bath
2,122
Sq Ft
$315/Sq Ft
Est. Value
About This Home
This home is located at 62 Mercury Ave, East Patchogue, NY 11772 and is currently estimated at $669,445, approximately $315 per square foot. 62 Mercury Ave is a home located in Suffolk County with nearby schools including Frank P Long Intermediate School, Bellport Middle School, and Bellport Senior High School.
Ownership History
Date
Name
Owned For
Owner Type
Purchase Details
Closed on
Apr 25, 2000
Sold by
Deutsch Edward and Deutsch Mary
Bought by
Bennett Marylynn A and Bennett Donald L
Current Estimated Value
Home Financials for this Owner
Home Financials are based on the most recent Mortgage that was taken out on this home.
Original Mortgage
$129,650
Outstanding Balance
$45,016
Interest Rate
8.21%
Estimated Equity
$624,429
Purchase Details
Closed on
Jun 12, 1996
Sold by
Deutsch Joan
Bought by
Deutsch Edward and Deutsch Mary
Create a Home Valuation Report for This Property
The Home Valuation Report is an in-depth analysis detailing your home's value as well as a comparison with similar homes in the area
Home Values in the Area
Average Home Value in this Area
Purchase History
| Date | Buyer | Sale Price | Title Company |
|---|---|---|---|
| Bennett Marylynn A | $136,500 | -- | |
| Deutsch Edward | -- | First American Title Ins Co |
Source: Public Records
Mortgage History
| Date | Status | Borrower | Loan Amount |
|---|---|---|---|
| Open | Bennett Marylynn A | $129,650 |
Source: Public Records
Tax History
| Year | Tax Paid | Tax Assessment Tax Assessment Total Assessment is a certain percentage of the fair market value that is determined by local assessors to be the total taxable value of land and additions on the property. | Land | Improvement |
|---|---|---|---|---|
| 2024 | $11,990 | $2,850 | $250 | $2,600 |
| 2023 | $11,990 | $2,850 | $250 | $2,600 |
| 2022 | $10,864 | $2,850 | $250 | $2,600 |
| 2021 | $10,864 | $2,850 | $250 | $2,600 |
| 2020 | $11,228 | $2,850 | $250 | $2,600 |
| 2019 | $11,228 | $0 | $0 | $0 |
| 2018 | $10,631 | $2,850 | $250 | $2,600 |
| 2017 | $10,631 | $2,850 | $250 | $2,600 |
| 2016 | $10,580 | $2,850 | $250 | $2,600 |
| 2015 | -- | $2,850 | $250 | $2,600 |
| 2014 | -- | $2,850 | $250 | $2,600 |
Source: Public Records
Map
Nearby Homes
Your Personal Tour Guide
Ask me questions while you tour the home.