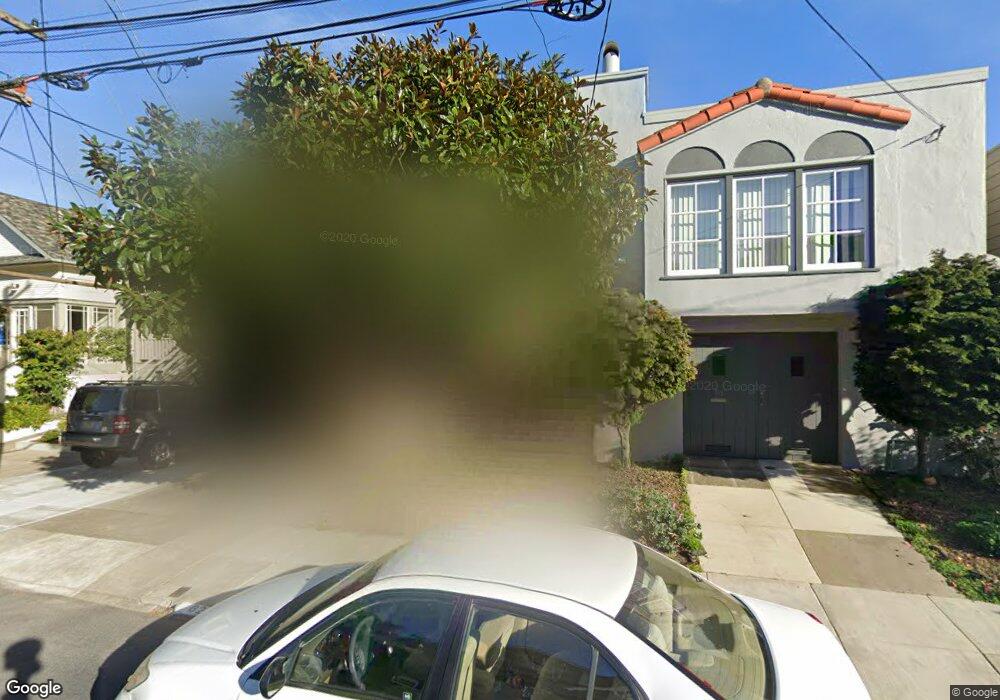
62 Nordhoff St San Francisco, CA 94131
Glen Park NeighborhoodEstimated Value: $1,104,686 - $1,720,000
2
Beds
1
Bath
1,175
Sq Ft
$1,178/Sq Ft
Est. Value
About This Home
This home is located at 62 Nordhoff St, San Francisco, CA 94131 and is currently estimated at $1,384,422, approximately $1,178 per square foot. 62 Nordhoff St is a home located in San Francisco County with nearby schools including Glen Park Elementary School, James Lick Middle School, and Leadership High School.
Ownership History
Date
Name
Owned For
Owner Type
Purchase Details
Closed on
Jan 25, 2006
Sold by
Osmer Kimberly D
Bought by
Osmer Kimberly D
Current Estimated Value
Purchase Details
Closed on
Jul 9, 1997
Sold by
Reisman Mark S
Bought by
Osmer Kimberly D
Home Financials for this Owner
Home Financials are based on the most recent Mortgage that was taken out on this home.
Original Mortgage
$267,600
Outstanding Balance
$38,348
Interest Rate
7.5%
Estimated Equity
$1,346,074
Create a Home Valuation Report for This Property
The Home Valuation Report is an in-depth analysis detailing your home's value as well as a comparison with similar homes in the area
Home Values in the Area
Average Home Value in this Area
Purchase History
| Date | Buyer | Sale Price | Title Company |
|---|---|---|---|
| Osmer Kimberly D | -- | None Available | |
| Osmer Kimberly D | $334,500 | First American Title Guarant |
Source: Public Records
Mortgage History
| Date | Status | Borrower | Loan Amount |
|---|---|---|---|
| Open | Osmer Kimberly D | $267,600 |
Source: Public Records
Tax History Compared to Growth
Tax History
| Year | Tax Paid | Tax Assessment Tax Assessment Total Assessment is a certain percentage of the fair market value that is determined by local assessors to be the total taxable value of land and additions on the property. | Land | Improvement |
|---|---|---|---|---|
| 2025 | $6,163 | $534,093 | $374,428 | $159,665 |
| 2024 | $6,163 | $523,622 | $367,087 | $156,535 |
| 2023 | $6,074 | $513,356 | $359,890 | $153,466 |
| 2022 | $5,966 | $503,291 | $352,834 | $150,457 |
| 2021 | $5,863 | $493,423 | $345,916 | $147,507 |
| 2020 | $5,880 | $488,365 | $342,370 | $145,995 |
| 2019 | $6,288 | $478,790 | $335,657 | $143,133 |
| 2018 | $6,076 | $469,403 | $329,076 | $140,327 |
| 2017 | $5,766 | $460,200 | $322,624 | $137,576 |
| 2016 | $5,712 | $451,178 | $316,299 | $134,879 |
| 2015 | $5,638 | $444,401 | $311,548 | $132,853 |
| 2014 | $5,491 | $435,697 | $305,446 | $130,251 |
Source: Public Records
Map
Nearby Homes
- 222 Monterey Blvd
- 47 Melrose Ave
- 25 Mizpah St
- 58 Monterey Blvd
- 54-56 Monterey Blvd
- 169 Brompton Ave
- 471 Joost Ave
- 335 Hearst Ave
- 2608 Diamond St
- 258 Flood Ave
- 225 Cotter St
- 408 Gold Mine Dr
- 201 Detroit St
- 538 Joost Ave
- 43 Sussex St
- 1849 San Jose Ave
- 554 Monterey Blvd
- 338 Marietta Dr
- 200 Cayuga Ave
- 101 Moffitt St