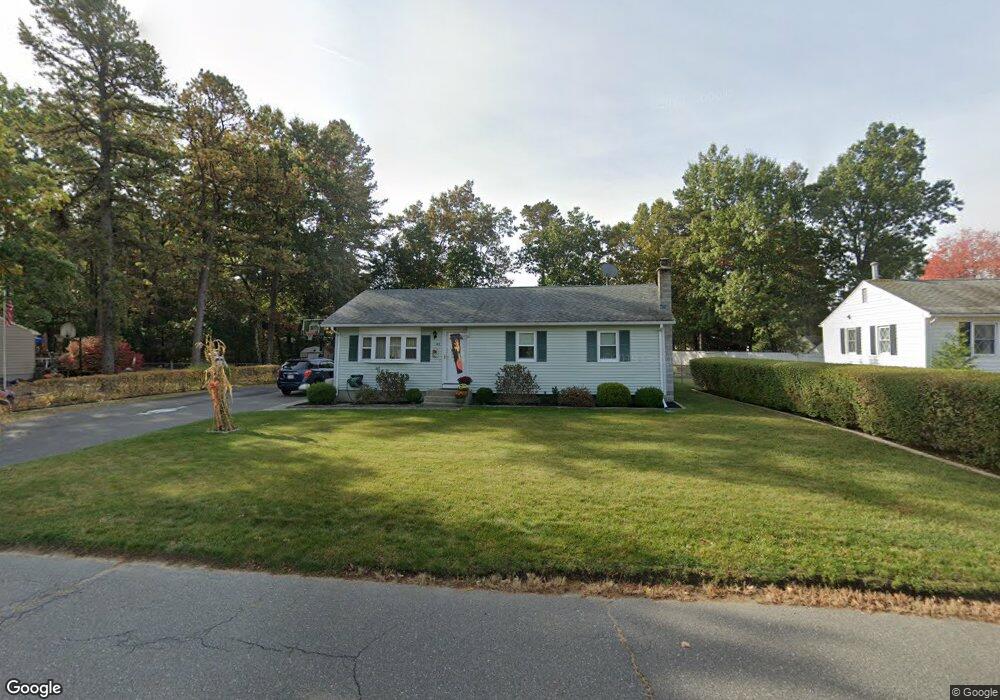
62 Phelps St Easthampton, MA 01027
Estimated Value: $338,000 - $357,000
3
Beds
3
Baths
983
Sq Ft
$353/Sq Ft
Est. Value
About This Home
This home is located at 62 Phelps St, Easthampton, MA 01027 and is currently estimated at $346,677, approximately $352 per square foot. 62 Phelps St is a home located in Hampshire County with nearby schools including Easthampton High School, Calvary Baptist Christian School, and Tri-County Schools.
Ownership History
Date
Name
Owned For
Owner Type
Purchase Details
Closed on
Feb 28, 1990
Sold by
Wainwright Robet D
Bought by
Nomakeo Robert J
Current Estimated Value
Home Financials for this Owner
Home Financials are based on the most recent Mortgage that was taken out on this home.
Original Mortgage
$101,600
Interest Rate
9.78%
Mortgage Type
Purchase Money Mortgage
Create a Home Valuation Report for This Property
The Home Valuation Report is an in-depth analysis detailing your home's value as well as a comparison with similar homes in the area
Home Values in the Area
Average Home Value in this Area
Purchase History
| Date | Buyer | Sale Price | Title Company |
|---|---|---|---|
| Nomakeo Robert J | $107,000 | -- |
Source: Public Records
Mortgage History
| Date | Status | Borrower | Loan Amount |
|---|---|---|---|
| Open | Nomakeo Robert J | $98,000 | |
| Closed | Nomakeo Robert J | $101,600 |
Source: Public Records
Tax History
| Year | Tax Paid | Tax Assessment Tax Assessment Total Assessment is a certain percentage of the fair market value that is determined by local assessors to be the total taxable value of land and additions on the property. | Land | Improvement |
|---|---|---|---|---|
| 2025 | $4,227 | $309,200 | $119,700 | $189,500 |
| 2024 | $4,130 | $304,600 | $116,300 | $188,300 |
| 2023 | $3,202 | $218,600 | $91,600 | $127,000 |
| 2022 | $3,613 | $218,600 | $91,600 | $127,000 |
| 2021 | $3,938 | $224,500 | $91,600 | $132,900 |
| 2020 | $3,882 | $218,600 | $91,600 | $127,000 |
| 2019 | $3,270 | $211,500 | $91,600 | $119,900 |
| 2018 | $3,146 | $196,600 | $86,100 | $110,500 |
| 2017 | $3,010 | $185,700 | $82,900 | $102,800 |
| 2016 | $3,106 | $199,200 | $82,900 | $116,300 |
| 2015 | $3,018 | $199,200 | $82,900 | $116,300 |
Source: Public Records
Map
Nearby Homes
Your Personal Tour Guide
Ask me questions while you tour the home.