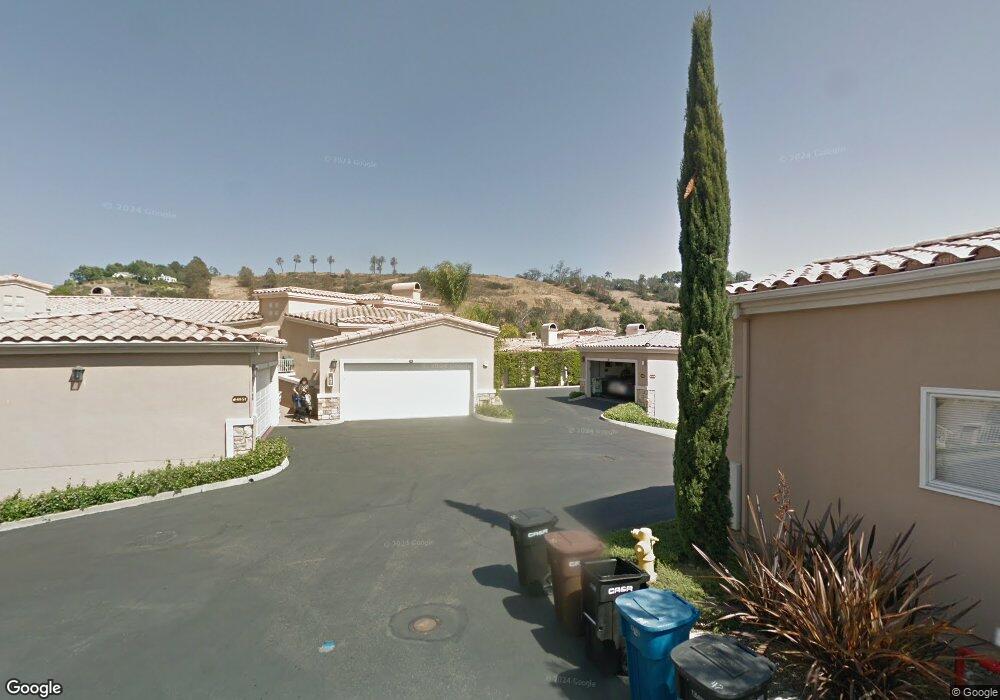
62 Plaza Quinta Unit 100 San Juan Capistrano, CA 92675
Estimated Value: $1,080,456 - $1,286,000
2
Beds
2
Baths
1,779
Sq Ft
$658/Sq Ft
Est. Value
About This Home
This home is located at 62 Plaza Quinta Unit 100, San Juan Capistrano, CA 92675 and is currently estimated at $1,171,364, approximately $658 per square foot. 62 Plaza Quinta Unit 100 is a home located in Orange County with nearby schools including Harold Ambuehl Elementary School, Marco Forster Middle School, and San Juan Hills High School.
Ownership History
Date
Name
Owned For
Owner Type
Purchase Details
Closed on
Oct 26, 2022
Sold by
Boland Daniel M
Bought by
Daniel M Boland Living Trust
Current Estimated Value
Purchase Details
Closed on
Oct 9, 2019
Sold by
Boland Dan
Bought by
Boland Daniel M and Boland Parke Survivor S Trust
Purchase Details
Closed on
Aug 7, 2019
Sold by
Fowle John
Bought by
Boland Dan
Purchase Details
Closed on
Jan 20, 2006
Sold by
Fowle John M
Bought by
Fowle John and 2006 Fowle Family Trust
Purchase Details
Closed on
May 6, 1999
Sold by
Harold Brande and Harold Dorothy
Bought by
Fowle John M
Home Financials for this Owner
Home Financials are based on the most recent Mortgage that was taken out on this home.
Original Mortgage
$300,000
Interest Rate
6.94%
Purchase Details
Closed on
Feb 21, 1996
Sold by
Hawthorne Svgs Fsb
Bought by
Brande Harold and Brande Dorothy Wanita
Create a Home Valuation Report for This Property
The Home Valuation Report is an in-depth analysis detailing your home's value as well as a comparison with similar homes in the area
Home Values in the Area
Average Home Value in this Area
Purchase History
| Date | Buyer | Sale Price | Title Company |
|---|---|---|---|
| Daniel M Boland Living Trust | -- | -- | |
| Boland Daniel M | -- | -- | |
| Boland Daniel M | -- | -- | |
| Boland Daniel M | -- | None Available | |
| Boland Dan | $815,000 | Chicago Title Company | |
| Fowle John | -- | None Available | |
| Fowle John M | $378,500 | -- | |
| Brande Harold | $198,090 | Continental Lawyers Title |
Source: Public Records
Mortgage History
| Date | Status | Borrower | Loan Amount |
|---|---|---|---|
| Previous Owner | Fowle John M | $300,000 |
Source: Public Records
Tax History Compared to Growth
Tax History
| Year | Tax Paid | Tax Assessment Tax Assessment Total Assessment is a certain percentage of the fair market value that is determined by local assessors to be the total taxable value of land and additions on the property. | Land | Improvement |
|---|---|---|---|---|
| 2025 | $9,349 | $901,929 | $637,390 | $264,539 |
| 2024 | $9,349 | $884,245 | $624,893 | $259,352 |
| 2023 | $9,114 | $866,907 | $612,640 | $254,267 |
| 2022 | $8,663 | $839,911 | $590,474 | $249,437 |
| 2021 | $8,504 | $823,443 | $578,896 | $244,547 |
| 2020 | $8,429 | $815,000 | $572,960 | $242,040 |
| 2019 | $5,510 | $531,649 | $298,903 | $232,746 |
| 2018 | $5,411 | $521,225 | $293,042 | $228,183 |
| 2017 | $5,362 | $511,005 | $287,296 | $223,709 |
| 2016 | $5,263 | $500,986 | $281,663 | $219,323 |
| 2015 | $5,183 | $493,461 | $277,432 | $216,029 |
| 2014 | $5,092 | $483,795 | $271,997 | $211,798 |
Source: Public Records
Map
Nearby Homes
- 70 Plaza Cuesta
- 90 Plaza de Las Flores
- 30981 Via Mirador
- 30532 Marbella Vista
- 27381 Via Priorato
- 27591 Rolling Wood Ln
- 30372 Marbella Vista
- 27703 Ortega Hwy Unit 13
- 27703 Ortega Hwy Unit 127
- 30431 Via Festivo
- 30828 Calle Chueca
- 31121 Via Santo Tomas
- 31261 Paseo Olivos
- 27281 Viewpoint Cir
- 31024 Calle San Diego Unit 94b
- 31278 Calle San Juan Unit 12
- 31284 Calle San Juan Unit 14
- 26447 Paseo Carmel Unit 11D
- 26468 Calle San Antonio
- 30932 Steeplechase Dr
- 62 Plaza Quinta
- 64 Plaza Quinta
- 66 Plaza Quinta
- 65 Plaza Quinta
- 63 Plaza Quinta Unit 63
- 88 Plaza de Las Flor
- 56 Plaza Brisas
- 57 Plaza Brisas Unit 1
- 57 Plaza Brisas
- 59 Plaza Brisas
- 57 Plaza Brisas
- 60 Plaza Brisas
- 58 Plaza Brisas Unit 58
- 89 Plaza de Las Flores
- 54 Plaza Brisas
- 91 Plaza de Las Flores
- 69 Plaza Cuesta Unit 69
- 68 Plaza Cuesta Unit 68
- 92 Plaza de Las Flores Unit 92
- 80 Plaza Cuesta Unit 80