
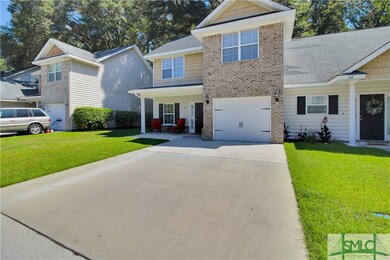


62 Shady Oaks Loop Midway, GA 31320
Estimated Value: $198,000 - $271,000
About This Home
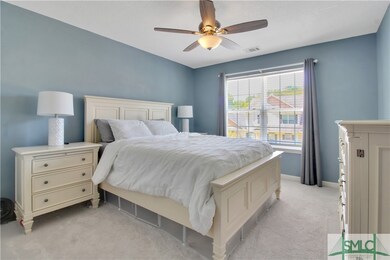
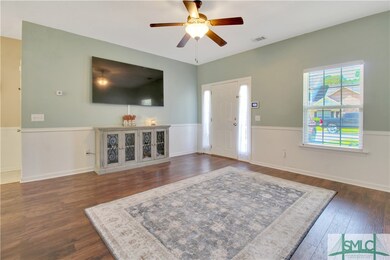
As of August 2023Great opportunity in Midway! This charming 3 bed 2.5 bath townhome comes with new carpet, new paint throughout, new refriderator, new oven and new microwave! A new washer and dryer also stays with the home! New roof was put on in September of 2022! This home provides a semi-open concept with a spacious living room, breakfast nook, and kitchen. Upstairs you have two bedrooms and the owner's suite with trayed ceilings, a walk-in closet, and a private bathroom. This townhome is an end unit, so plenty of privacy! Don't miss this opportunity in a great location!
Townhouse Details
Home Type
Townhome
Year Built
2007
Lot Details
0
Parking
1
Listing Details
- Property Type: Residential
- Year Built: 2007
- Special Features: None
- Property Sub Type: Townhouses
- Stories: 2
Interior Features
- Interior Amenities: Ceiling Fan(s), Pantry, Pull Down Attic Stairs
Utilities
- Water Source: Public
MLS Schools
- Elementary School: LES
- High School: Liberty High
Ownership History
Purchase Details
Home Financials for this Owner
Home Financials are based on the most recent Mortgage that was taken out on this home.Purchase Details
Purchase Details
Home Financials for this Owner
Home Financials are based on the most recent Mortgage that was taken out on this home.Purchase Details
Purchase Details
Home Values in the Area
Average Home Value in this Area
Purchase History
| Date | Buyer | Sale Price | Title Company |
|---|---|---|---|
| Stout Casey Alan | $203,999 | -- | |
| Molnar Kris | $164,000 | -- | |
| Dangelo Bonny J | $125,000 | -- | |
| Queensborough National Bank & Trust Comp | $249,000 | -- | |
| Legacy Custom Builders Llc | $140,000 | -- |
Mortgage History
| Date | Status | Borrower | Loan Amount |
|---|---|---|---|
| Open | Stout Casey Alan | $205,059 | |
| Previous Owner | Dangelo Bonny J | $122,735 |
Property History
| Date | Event | Price | List to Sale | Price per Sq Ft |
|---|---|---|---|---|
| 08/17/2023 08/17/23 | Sold | $203,999 | +7.4% | $131 / Sq Ft |
| 07/18/2023 07/18/23 | Pending | -- | -- | -- |
| 07/13/2023 07/13/23 | For Sale | $190,000 | -- | $122 / Sq Ft |
Tax History Compared to Growth
Tax History
| Year | Tax Paid | Tax Assessment Tax Assessment Total Assessment is a certain percentage of the fair market value that is determined by local assessors to be the total taxable value of land and additions on the property. | Land | Improvement |
|---|---|---|---|---|
| 2024 | $3,320 | $79,306 | $6,000 | $73,306 |
| 2023 | $3,320 | $67,031 | $6,000 | $61,031 |
| 2022 | $2,006 | $55,805 | $6,000 | $49,805 |
| 2021 | $1,289 | $37,291 | $6,000 | $31,291 |
| 2020 | $1,304 | $37,639 | $6,000 | $31,639 |
| 2019 | $1,222 | $36,303 | $6,000 | $30,303 |
| 2018 | $1,030 | $31,527 | $6,000 | $25,527 |
| 2017 | $1,349 | $31,802 | $6,000 | $25,802 |
| 2016 | $981 | $32,076 | $6,000 | $26,076 |
| 2015 | $1,037 | $32,076 | $6,000 | $26,076 |
| 2014 | $1,037 | $33,397 | $6,000 | $27,397 |
| 2013 | -- | $36,380 | $6,000 | $30,380 |
Map
Source: Hive MLS
MLS Number: 292036
APN: 213B-070
Disclaimer: Certain information contained herein is derived from information provided by parties other than Homes.com. All information provided is deemed reliable, but is not guaranteed to be accurate and should be independently verified.
![]() IDX information is provided exclusively for personal, non-commercial use, and may not be used for any purpose other than to identify prospective properties consumers may be interested in purchasing.
IDX information is provided exclusively for personal, non-commercial use, and may not be used for any purpose other than to identify prospective properties consumers may be interested in purchasing.
Information is deemed reliable but not guaranteed.
- 80 Shady Oaks Loop
- 0 Marie, Lot 26 Marie Ave
- O Marie, Lot 27 Marie Ave
- 0 Marie lot 15 Marie Ave
- 0 Marie Lot 9 Marie Ave
- 0 Marie, Lot 2 Marie Ave
- 141 Colonial Dr
- 13208 E Oglethorpe Hwy
- 1 Acre E Oglethorpe Hwy
- 7.47 E Oglethorpe Hwy
- 1.54 Acres E Oglethorpe Hwy
- 1.54 Ac E Oglethorpe Hwy
- 1 AC E Oglethorpe Hwy
- 78 Button Gwinnett Ave
- 81 Button Gwinnett Ave
- 151 Hollingsworth Blvd
- 161 C Jones St
- 229 Hollingsworth Blvd
- 58 Saint Catherine St
- 35 Bartram Ave
- 62 Shady Oaks Loop
- 66 Shady Oaks Loop
- 66 Shady Oaks Loop
- 54 Shady Oaks Loop
- 54 Shady Oaks Loop
- 70 Shady Oaks Loop
- 50 Shady Oaks Loop
- 50 Shady Oaks Loop
- 76 Shady Oaks Loop
- 76 Shady Oaks Loop
- 46 Shady Oaks Loop
- 46 Shady Oaks Loop
- 67 Shady Oaks Loop
- 67 Shady Oaks Loop
- 61 Shady Oaks Loop
- 73 Shady Oaks Loop
- 80 Shady Oaks Loop
- 61 Shady Oaks Loop
- 73 Shady Oaks Loop
- 42 Shady Oaks Loop