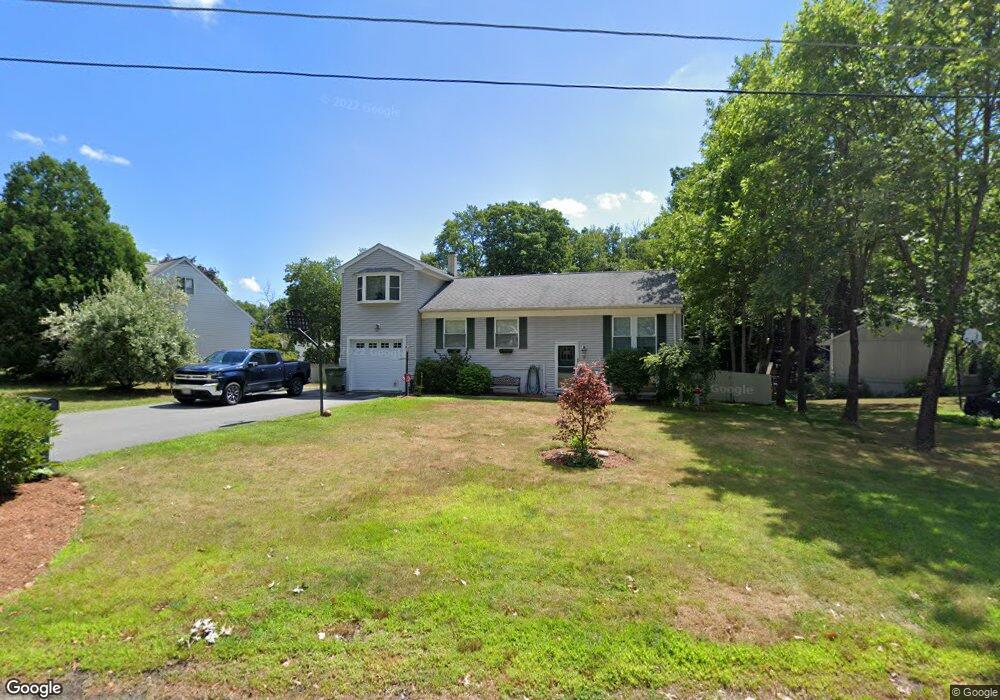
62 Sheryl Dr Whitinsville, MA 01588
Estimated Value: $482,000 - $515,000
3
Beds
3
Baths
1,510
Sq Ft
$326/Sq Ft
Est. Value
About This Home
This home is located at 62 Sheryl Dr, Whitinsville, MA 01588 and is currently estimated at $492,097, approximately $325 per square foot. 62 Sheryl Dr is a home located in Worcester County with nearby schools including Northbridge Elementary School, Northbridge Middle School, and Northbridge High School.
Ownership History
Date
Name
Owned For
Owner Type
Purchase Details
Closed on
Sep 29, 2004
Sold by
Perro Victoria M and Tevepaugh Victoria M
Bought by
Johnson Lynn D and Johnson William D
Current Estimated Value
Home Financials for this Owner
Home Financials are based on the most recent Mortgage that was taken out on this home.
Original Mortgage
$190,000
Outstanding Balance
$93,028
Interest Rate
5.81%
Mortgage Type
Purchase Money Mortgage
Estimated Equity
$399,069
Purchase Details
Closed on
Apr 21, 1998
Sold by
Gontijo Nelson D and Gontijo Kerryn L
Bought by
Tevepaugh Victoria M
Home Financials for this Owner
Home Financials are based on the most recent Mortgage that was taken out on this home.
Original Mortgage
$116,850
Interest Rate
7.11%
Mortgage Type
Purchase Money Mortgage
Purchase Details
Closed on
Dec 17, 1993
Sold by
Givner James E and Givner Kathleen A
Bought by
Gontijo Nelson D and Gontijo Kerryn L
Create a Home Valuation Report for This Property
The Home Valuation Report is an in-depth analysis detailing your home's value as well as a comparison with similar homes in the area
Home Values in the Area
Average Home Value in this Area
Purchase History
| Date | Buyer | Sale Price | Title Company |
|---|---|---|---|
| Johnson Lynn D | $240,000 | -- | |
| Johnson Lynn D | $240,000 | -- | |
| Tevepaugh Victoria M | $120,500 | -- | |
| Tevepaugh Victoria M | $120,500 | -- | |
| Gontijo Nelson D | $95,000 | -- | |
| Gontijo Nelson D | $95,000 | -- |
Source: Public Records
Mortgage History
| Date | Status | Borrower | Loan Amount |
|---|---|---|---|
| Open | Johnson Lynn D | $190,000 | |
| Closed | Gontijo Nelson D | $190,000 | |
| Previous Owner | Gontijo Nelson D | $116,850 |
Source: Public Records
Tax History Compared to Growth
Tax History
| Year | Tax Paid | Tax Assessment Tax Assessment Total Assessment is a certain percentage of the fair market value that is determined by local assessors to be the total taxable value of land and additions on the property. | Land | Improvement |
|---|---|---|---|---|
| 2025 | $4,641 | $393,600 | $136,400 | $257,200 |
| 2024 | $4,563 | $377,400 | $136,400 | $241,000 |
| 2023 | $4,694 | $362,200 | $136,400 | $225,800 |
| 2022 | $4,161 | $302,200 | $104,900 | $197,300 |
| 2021 | $4,086 | $282,000 | $99,900 | $182,100 |
| 2020 | $3,499 | $252,800 | $99,900 | $152,900 |
| 2019 | $3,171 | $244,500 | $99,900 | $144,600 |
| 2018 | $3,015 | $233,000 | $95,100 | $137,900 |
| 2017 | $2,684 | $198,400 | $85,600 | $112,800 |
| 2016 | $2,448 | $178,000 | $73,500 | $104,500 |
| 2015 | $2,382 | $178,000 | $73,500 | $104,500 |
| 2014 | $2,360 | $178,000 | $73,500 | $104,500 |
Source: Public Records
Map
Nearby Homes
- 119 Susanne Dr
- 1880 Providence Rd
- 151 Fowler Rd
- 0 Puddon St
- 135 Windstone Dr
- 157 Rolling Ridge Dr Unit 84
- 1825 Quaker St
- 73 Plummer Ave
- 42 Shining Rock Dr
- 1076 Hill St
- 79-81 Upton St
- 86 Kingsnorth St
- 708 Marston Rd
- 1052 Providence Rd
- 192 Rebecca Rd
- 731 Samuel Dr
- 46 Rebecca Rd
- 140 Rolling Ridge Dr Unit 78
- 169 Rolling Ridge Dr Unit 97
- 90 Nathaniel Dr