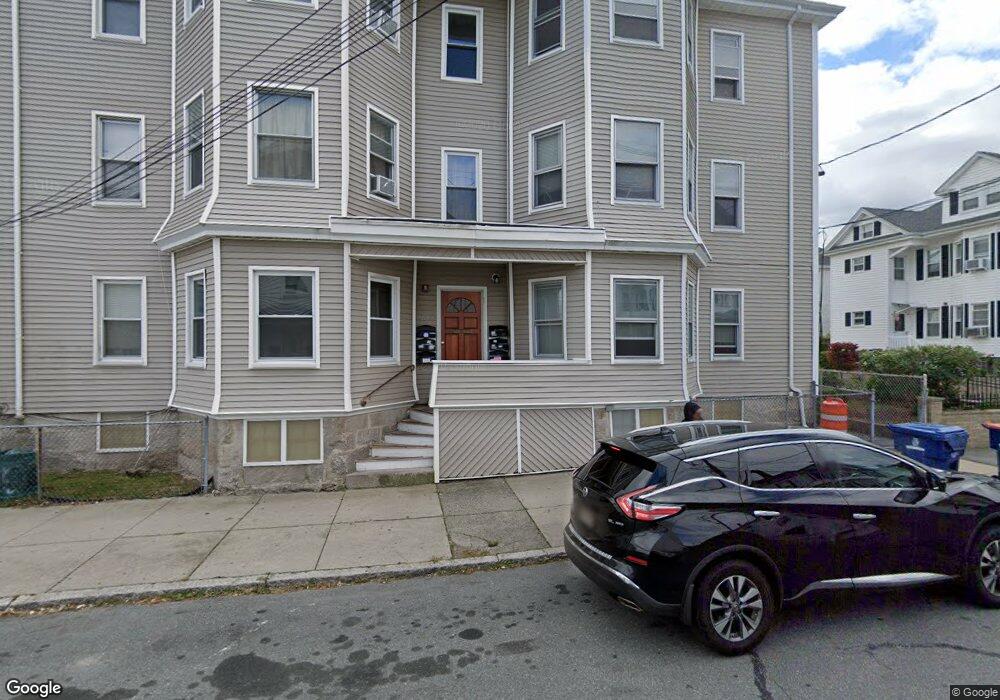
62 Sidney St New Bedford, MA 02740
The South End NeighborhoodEstimated Value: $601,177
12
Beds
6
Baths
6,710
Sq Ft
$90/Sq Ft
Est. Value
About This Home
This home is located at 62 Sidney St, New Bedford, MA 02740 and is currently estimated at $601,177, approximately $89 per square foot. 62 Sidney St is a home located in Bristol County with nearby schools including John B. DeValles Elementary School, Roosevelt Middle School, and New Bedford High School.
Ownership History
Date
Name
Owned For
Owner Type
Purchase Details
Closed on
Dec 6, 2006
Sold by
Chester-Letendre Jessica
Bought by
C & L Prop Llc
Current Estimated Value
Home Financials for this Owner
Home Financials are based on the most recent Mortgage that was taken out on this home.
Original Mortgage
$240,000
Outstanding Balance
$144,028
Interest Rate
6.47%
Mortgage Type
Commercial
Estimated Equity
$457,149
Purchase Details
Closed on
Nov 1, 2006
Sold by
Nunes Albert
Bought by
Chester-Letendre Jessica
Home Financials for this Owner
Home Financials are based on the most recent Mortgage that was taken out on this home.
Original Mortgage
$240,000
Outstanding Balance
$144,028
Interest Rate
6.47%
Mortgage Type
Commercial
Estimated Equity
$457,149
Create a Home Valuation Report for This Property
The Home Valuation Report is an in-depth analysis detailing your home's value as well as a comparison with similar homes in the area
Home Values in the Area
Average Home Value in this Area
Purchase History
| Date | Buyer | Sale Price | Title Company |
|---|---|---|---|
| C & L Prop Llc | -- | -- | |
| C & L Prop Llc | -- | -- | |
| Chester-Letendre Jessica | $320,000 | -- | |
| Chester-Letendre Jessica | $320,000 | -- |
Source: Public Records
Mortgage History
| Date | Status | Borrower | Loan Amount |
|---|---|---|---|
| Open | Chester-Letendre Jessica | $240,000 | |
| Closed | Chester-Letendre Jessica | $240,000 |
Source: Public Records
Tax History Compared to Growth
Tax History
| Year | Tax Paid | Tax Assessment Tax Assessment Total Assessment is a certain percentage of the fair market value that is determined by local assessors to be the total taxable value of land and additions on the property. | Land | Improvement |
|---|---|---|---|---|
| 2025 | -- | $712,500 | $108,300 | $604,200 |
| 2024 | -- | $666,100 | $104,400 | $561,700 |
| 2023 | $0 | $525,500 | $87,400 | $438,100 |
| 2022 | $0 | $437,600 | $85,100 | $352,500 |
| 2021 | $0 | $363,200 | $81,200 | $282,000 |
| 2020 | $0 | $407,500 | $81,200 | $326,300 |
| 2019 | $0 | $343,500 | $81,200 | $262,300 |
| 2018 | $0 | $338,300 | $81,200 | $257,100 |
| 2017 | $0 | $336,100 | $83,200 | $252,900 |
| 2016 | -- | $318,000 | $83,200 | $234,800 |
| 2015 | -- | $315,400 | $83,200 | $232,200 |
| 2014 | -- | $319,200 | $83,200 | $236,000 |
Source: Public Records
Map
Nearby Homes
- 175 Hemlock St
- 74 Sidney St
- 71 Sagamore St
- 168 Hemlock St Unit 2
- 76 Sidney St
- 159 Hemlock St
- 67 Sidney St
- 162 Hemlock St
- 71 Sidney St
- 75 Sagamore St
- 80 Sidney St
- 157 Hemlock St
- 181 Hemlock St Unit 183
- 40 Sidney St
- 77 Sidney St
- 158 Hemlock St Unit 160
- 43 Sagamore St
- 43 Sagamore St Unit 3
- 72 Dunbar St Unit 74
- 68 Sagamore St