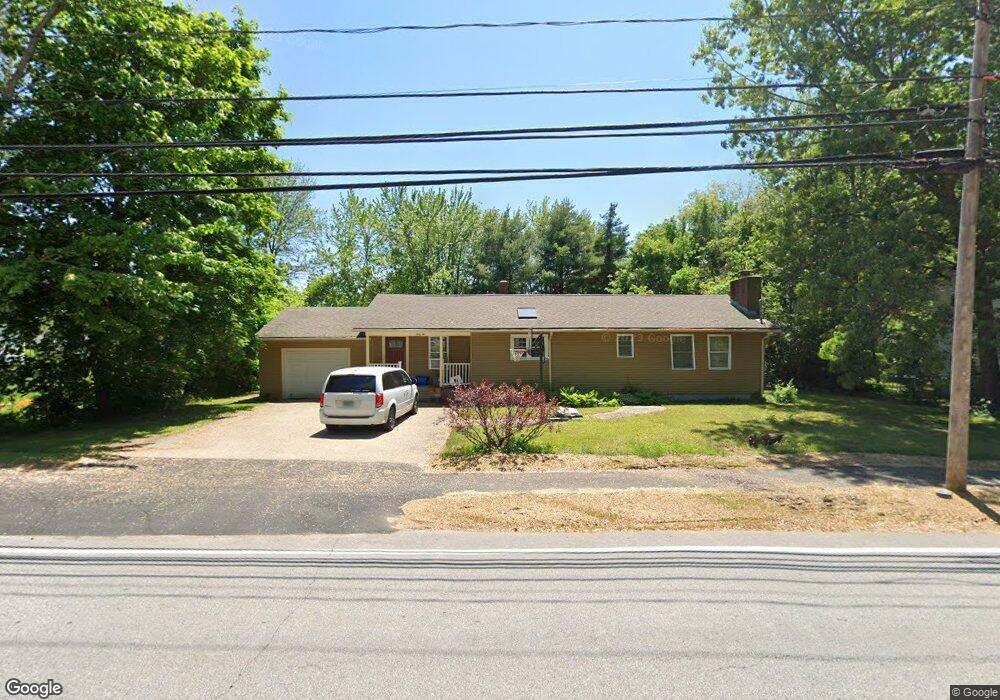
62 W High St Somersworth, NH 03878
Estimated Value: $445,705 - $506,000
3
Beds
2
Baths
1,400
Sq Ft
$337/Sq Ft
Est. Value
About This Home
This home is located at 62 W High St, Somersworth, NH 03878 and is currently estimated at $471,676, approximately $336 per square foot. 62 W High St is a home located in Strafford County with nearby schools including Maple Wood Elementary School, Somersworth High School, and Tri-City Christian Academy.
Ownership History
Date
Name
Owned For
Owner Type
Purchase Details
Closed on
Aug 31, 2009
Sold by
Harmon Scott T and Knight Jonathan R
Bought by
Levins Maureen T
Current Estimated Value
Home Financials for this Owner
Home Financials are based on the most recent Mortgage that was taken out on this home.
Original Mortgage
$122,400
Outstanding Balance
$79,968
Interest Rate
5.17%
Estimated Equity
$391,708
Purchase Details
Closed on
Jan 15, 2009
Sold by
Wells Fargo Bank Na Tr
Bought by
Harmon Scott T and Knight Jonathan R
Purchase Details
Closed on
Mar 4, 2008
Sold by
Gowen Wendy J
Bought by
Wells Fargo Bank Na
Purchase Details
Closed on
Jun 1, 1999
Sold by
Weed Donald R
Bought by
Osborne Wendy J
Home Financials for this Owner
Home Financials are based on the most recent Mortgage that was taken out on this home.
Original Mortgage
$91,800
Interest Rate
6.82%
Create a Home Valuation Report for This Property
The Home Valuation Report is an in-depth analysis detailing your home's value as well as a comparison with similar homes in the area
Home Values in the Area
Average Home Value in this Area
Purchase History
| Date | Buyer | Sale Price | Title Company |
|---|---|---|---|
| Levins Maureen T | $204,000 | -- | |
| Levins Maureen T | $204,000 | -- | |
| Harmon Scott T | $107,100 | -- | |
| Wells Fargo Bank Na | $195,400 | -- | |
| Wells Fargo Bank Na | $195,400 | -- | |
| Osborne Wendy J | $102,000 | -- | |
| Osborne Wendy J | $102,000 | -- |
Source: Public Records
Mortgage History
| Date | Status | Borrower | Loan Amount |
|---|---|---|---|
| Open | Osborne Wendy J | $122,400 | |
| Closed | Osborne Wendy J | $122,400 | |
| Previous Owner | Osborne Wendy J | $91,800 |
Source: Public Records
Tax History Compared to Growth
Tax History
| Year | Tax Paid | Tax Assessment Tax Assessment Total Assessment is a certain percentage of the fair market value that is determined by local assessors to be the total taxable value of land and additions on the property. | Land | Improvement |
|---|---|---|---|---|
| 2024 | $8,013 | $428,500 | $109,100 | $319,400 |
| 2023 | $7,346 | $250,700 | $36,300 | $214,400 |
| 2022 | $7,042 | $250,700 | $36,300 | $214,400 |
| 2021 | $6,902 | $250,700 | $36,300 | $214,400 |
| 2020 | $6,982 | $250,700 | $36,300 | $214,400 |
| 2019 | $6,839 | $250,700 | $36,300 | $214,400 |
| 2018 | $6,659 | $199,300 | $50,800 | $148,500 |
| 2017 | $6,588 | $199,100 | $50,800 | $148,300 |
| 2016 | $5,994 | $186,600 | $50,800 | $135,800 |
| 2015 | $6,018 | $186,600 | $50,800 | $135,800 |
| 2014 | $5,811 | $186,600 | $50,800 | $135,800 |
Source: Public Records
Map
Nearby Homes
- 178 High St
- 23 Mount Vernon St
- 19B Birch Hill Ln Unit 19B
- 18 Grand St
- 22A Birch Hill Ln Unit 22A
- 23A Birch Hill Ln Unit 23A
- 23B Birch Hill Ln Unit 23B
- 29 Chadwick Ln
- 24-26 Highland St
- 22B Birch Hill Ln Unit 22B
- 19A Birch Hill Ln Unit 19A
- 27B Birch Hill Ln Unit 27B
- 18 Lenox Dr Unit C
- 8 Myrtle St
- 25 High St
- 105-107 Main St
- 11 Linden St
- 208 Main St
- 52-54 Union St
- 1 Bridge St