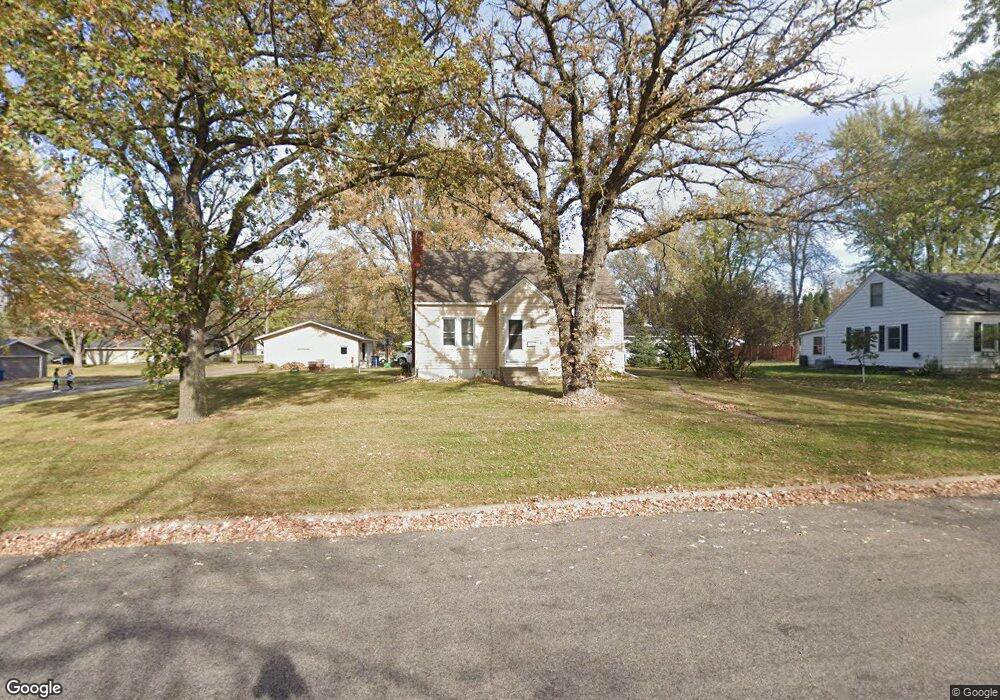
620 5th Ave N Sauk Rapids, MN 56379
Estimated Value: $213,000 - $229,000
3
Beds
1
Bath
1,184
Sq Ft
$186/Sq Ft
Est. Value
About This Home
This home is located at 620 5th Ave N, Sauk Rapids, MN 56379 and is currently estimated at $220,192, approximately $185 per square foot. 620 5th Ave N is a home located in Benton County with nearby schools including Pleasant View Elementary School, Sauk Rapids-Rice Middle School, and Sauk Rapids-Rice Senior High School.
Ownership History
Date
Name
Owned For
Owner Type
Purchase Details
Closed on
Jun 29, 2018
Sold by
Staneart Jean A
Bought by
Vavra Corin
Current Estimated Value
Home Financials for this Owner
Home Financials are based on the most recent Mortgage that was taken out on this home.
Original Mortgage
$127,775
Interest Rate
4.5%
Mortgage Type
New Conventional
Purchase Details
Closed on
Nov 10, 2010
Sold by
Staneart Hans D
Bought by
Stanearl Jean A
Create a Home Valuation Report for This Property
The Home Valuation Report is an in-depth analysis detailing your home's value as well as a comparison with similar homes in the area
Home Values in the Area
Average Home Value in this Area
Purchase History
| Date | Buyer | Sale Price | Title Company |
|---|---|---|---|
| Vavra Corin | $134,500 | Results Title | |
| Stanearl Jean A | -- | -- |
Source: Public Records
Mortgage History
| Date | Status | Borrower | Loan Amount |
|---|---|---|---|
| Previous Owner | Vavra Corin | $127,775 |
Source: Public Records
Tax History Compared to Growth
Tax History
| Year | Tax Paid | Tax Assessment Tax Assessment Total Assessment is a certain percentage of the fair market value that is determined by local assessors to be the total taxable value of land and additions on the property. | Land | Improvement |
|---|---|---|---|---|
| 2025 | $2,972 | $185,300 | $32,000 | $153,300 |
| 2024 | $2,920 | $178,600 | $32,000 | $146,600 |
| 2023 | $2,180 | $181,700 | $32,000 | $149,700 |
| 2022 | $2,094 | $161,800 | $29,100 | $132,700 |
| 2021 | $1,954 | $140,300 | $29,100 | $111,200 |
| 2020 | $1,968 | $131,400 | $28,000 | $103,400 |
| 2018 | $1,326 | $94,300 | $21,876 | $72,424 |
| 2017 | $1,326 | $87,900 | $21,439 | $66,461 |
| 2016 | $1,310 | $104,300 | $28,000 | $76,300 |
| 2015 | $1,316 | $70,800 | $20,004 | $50,796 |
| 2014 | -- | $66,500 | $19,559 | $46,941 |
| 2013 | -- | $68,300 | $19,756 | $48,544 |
Source: Public Records
Map
Nearby Homes
- 615 3rd Ave N
- 224 9th St N
- 216 8th Ave N
- 117 6th Ave N
- 314 Pleasant Ridge Dr
- 1101 10th Ave N
- 1107 10th Ave N
- 752 12th St N
- 1018 N Benton Dr
- 1201 10th Ave N
- 702 N Benton Dr
- 709 N Benton Dr
- 32467 County Road 1
- 112 Summit Ave S
- 2161 Mill Pond Dr
- 3322 321st St
- 3300 321st St
- 1406 Summit Ave N
- 1209 Millstone Ct
- 100 9th Ave S