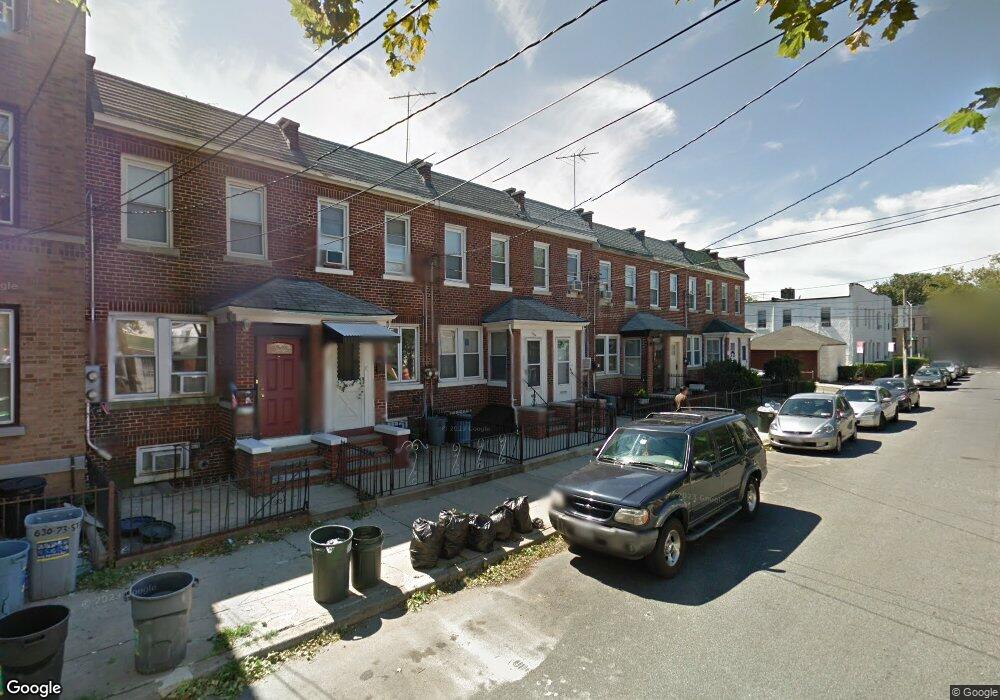
620 73rd St Brooklyn, NY 11209
Bay Ridge NeighborhoodEstimated Value: $849,000 - $959,000
2
Beds
2
Baths
938
Sq Ft
$964/Sq Ft
Est. Value
About This Home
This home is located at 620 73rd St, Brooklyn, NY 11209 and is currently estimated at $904,646, approximately $964 per square foot. 620 73rd St is a home located in Kings County with nearby schools including Junior High School 259 William McKinley, Fort Hamilton High School, and St Ephrem School.
Ownership History
Date
Name
Owned For
Owner Type
Purchase Details
Closed on
Jul 23, 2020
Sold by
Cicchetti Carmine A
Bought by
Cao Songqiao
Current Estimated Value
Home Financials for this Owner
Home Financials are based on the most recent Mortgage that was taken out on this home.
Original Mortgage
$429,000
Outstanding Balance
$381,115
Interest Rate
3.2%
Mortgage Type
Unknown
Estimated Equity
$523,531
Purchase Details
Closed on
Nov 3, 2003
Sold by
Fong Bruce
Bought by
Cicchetti Carmine A
Home Financials for this Owner
Home Financials are based on the most recent Mortgage that was taken out on this home.
Original Mortgage
$279,200
Interest Rate
5.89%
Mortgage Type
Purchase Money Mortgage
Create a Home Valuation Report for This Property
The Home Valuation Report is an in-depth analysis detailing your home's value as well as a comparison with similar homes in the area
Home Values in the Area
Average Home Value in this Area
Purchase History
| Date | Buyer | Sale Price | Title Company |
|---|---|---|---|
| Cao Songqiao | $660,000 | -- | |
| Cicchetti Carmine A | $349,000 | -- |
Source: Public Records
Mortgage History
| Date | Status | Borrower | Loan Amount |
|---|---|---|---|
| Open | Cao Songqiao | $429,000 | |
| Previous Owner | Cicchetti Carmine A | $279,200 |
Source: Public Records
Tax History
| Year | Tax Paid | Tax Assessment Tax Assessment Total Assessment is a certain percentage of the fair market value that is determined by local assessors to be the total taxable value of land and additions on the property. | Land | Improvement |
|---|---|---|---|---|
| 2025 | $6,265 | $50,100 | $12,060 | $38,040 |
| 2024 | $6,265 | $48,720 | $12,060 | $36,660 |
| 2023 | $5,977 | $52,320 | $12,060 | $40,260 |
| 2022 | $5,543 | $46,740 | $12,060 | $34,680 |
| 2021 | $5,823 | $44,040 | $12,060 | $31,980 |
| 2020 | $2,883 | $42,180 | $12,060 | $30,120 |
| 2019 | $5,438 | $46,680 | $12,060 | $34,620 |
| 2018 | $4,999 | $24,525 | $6,923 | $17,602 |
| 2017 | $4,717 | $23,140 | $7,245 | $15,895 |
| 2016 | $4,609 | $23,056 | $7,976 | $15,080 |
| 2015 | $2,413 | $22,962 | $9,661 | $13,301 |
| 2014 | $2,413 | $21,663 | $9,700 | $11,963 |
Source: Public Records
Map
Nearby Homes
Your Personal Tour Guide
Ask me questions while you tour the home.