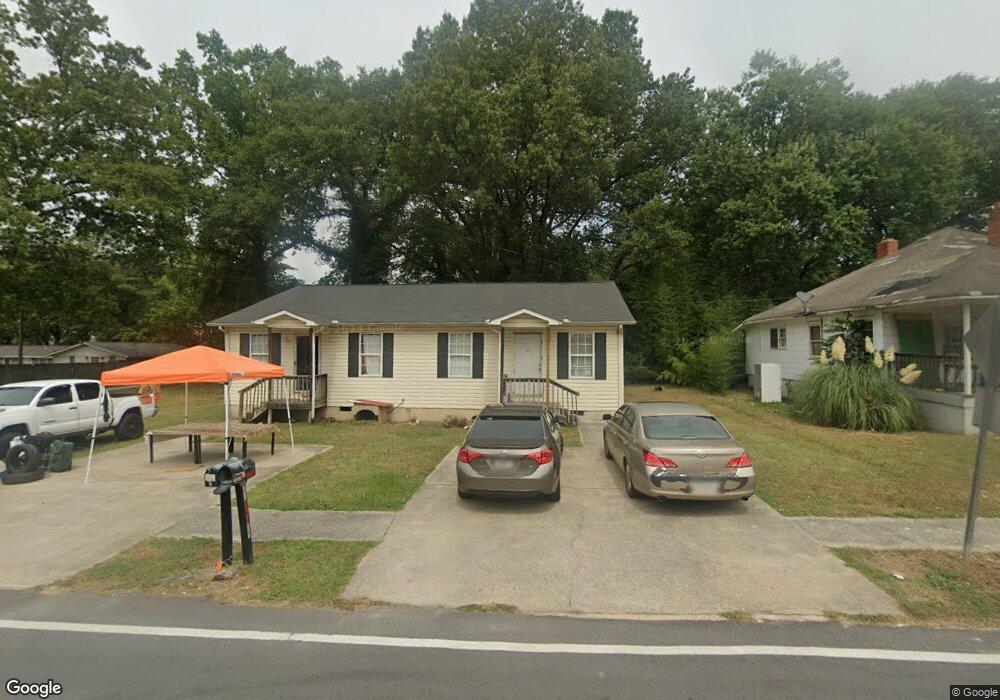
620 Cedar St Dalton, GA 30720
Estimated Value: $211,290 - $286,000
4
Beds
2
Baths
1,710
Sq Ft
$146/Sq Ft
Est. Value
About This Home
This home is located at 620 Cedar St, Dalton, GA 30720 and is currently estimated at $248,823, approximately $145 per square foot. 620 Cedar St is a home located in Whitfield County with nearby schools including Brookwood Elementary School, Dalton Middle School, and Dalton High School.
Ownership History
Date
Name
Owned For
Owner Type
Purchase Details
Closed on
Dec 17, 2015
Sold by
Cortez Rachel
Bought by
Su Ding Chen Llc
Current Estimated Value
Home Financials for this Owner
Home Financials are based on the most recent Mortgage that was taken out on this home.
Original Mortgage
$66,857
Interest Rate
3.98%
Mortgage Type
New Conventional
Purchase Details
Closed on
Mar 1, 2011
Sold by
Espinoza Marco Antonio
Bought by
Us Bank National Association
Purchase Details
Closed on
Jan 25, 2006
Sold by
Jones Wayne Edward
Bought by
Espinoza Marco Antonio
Home Financials for this Owner
Home Financials are based on the most recent Mortgage that was taken out on this home.
Original Mortgage
$112,500
Interest Rate
6.14%
Mortgage Type
New Conventional
Purchase Details
Closed on
Jun 2, 2000
Sold by
Mauldin Ronald and Mauldin Patricia
Bought by
Jones Wayne Edward and Deborah Ann
Purchase Details
Closed on
Dec 1, 1999
Bought by
Mauldin Ronald and Mauldin Patricia
Create a Home Valuation Report for This Property
The Home Valuation Report is an in-depth analysis detailing your home's value as well as a comparison with similar homes in the area
Home Values in the Area
Average Home Value in this Area
Purchase History
| Date | Buyer | Sale Price | Title Company |
|---|---|---|---|
| Su Ding Chen Llc | $80,000 | -- | |
| Us Bank National Association | $75,000 | -- | |
| Espinoza Marco Antonio | $125,000 | -- | |
| Jones Wayne Edward | $75,000 | -- | |
| Mauldin Ronald | $6,000 | -- |
Source: Public Records
Mortgage History
| Date | Status | Borrower | Loan Amount |
|---|---|---|---|
| Closed | Su Ding Chen Llc | $66,857 | |
| Previous Owner | Espinoza Marco Antonio | $112,500 |
Source: Public Records
Tax History Compared to Growth
Tax History
| Year | Tax Paid | Tax Assessment Tax Assessment Total Assessment is a certain percentage of the fair market value that is determined by local assessors to be the total taxable value of land and additions on the property. | Land | Improvement |
|---|---|---|---|---|
| 2024 | $2,121 | $77,366 | $7,600 | $69,766 |
| 2023 | $2,121 | $58,070 | $7,200 | $50,870 |
| 2022 | $1,472 | $42,743 | $8,400 | $34,343 |
| 2021 | $1,474 | $42,743 | $8,400 | $34,343 |
| 2020 | $1,531 | $42,743 | $8,400 | $34,343 |
| 2019 | $1,644 | $44,508 | $8,400 | $36,108 |
| 2018 | $1,263 | $33,676 | $8,400 | $25,276 |
| 2017 | $1,215 | $33,676 | $8,400 | $25,276 |
| 2016 | $942 | $25,928 | $2,940 | $22,988 |
| 2014 | $952 | $35,781 | $2,940 | $32,841 |
| 2013 | -- | $35,780 | $2,940 | $32,840 |
Source: Public Records
Map
Nearby Homes
- 920 Sunset Cir
- 934 Hardwick Cir
- 924 Stoneleigh Rd
- 903 Hillcrest St
- 1209 W Lakeshore Dr
- 703 W Walnut Ave
- 708 Miller St
- 914 W Walnut Ave
- 1411 Red Hill Dr
- 1307 Valencia Way
- 1105 Desota Dr
- 807 Judd Terrace
- 805 Judd Terrace
- 1230 Valencia Dr
- 705 Greenwood Dr
- 1117 Lakemont Dr
- 1504 Belmont Dr
- 1815 City View St