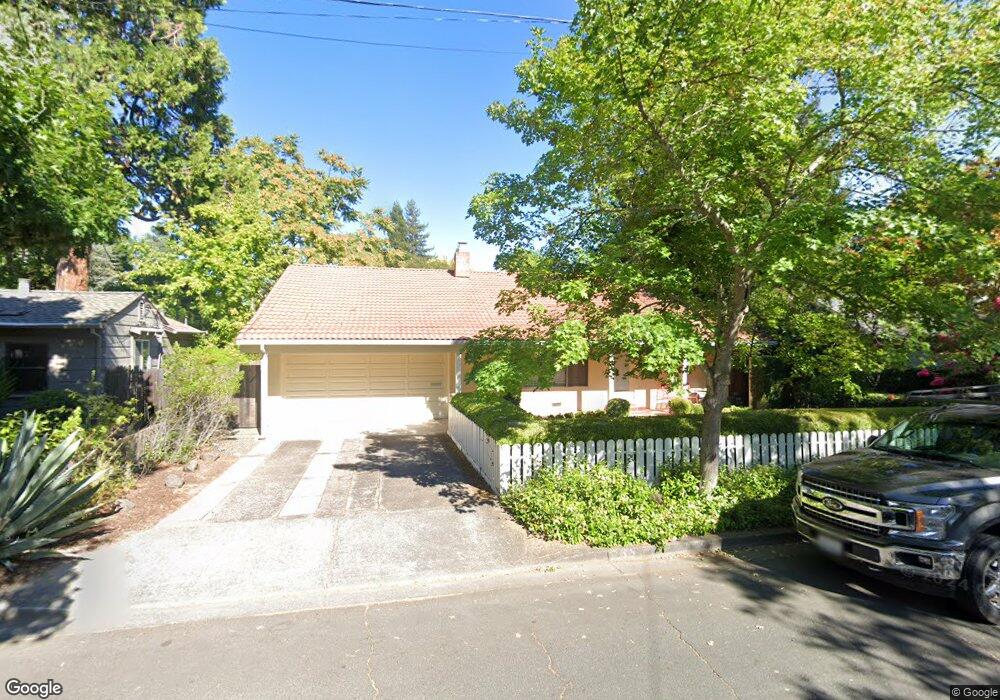
620 Donner Ave Sonoma, CA 95476
Estimated Value: $1,175,107 - $1,513,000
2
Beds
2
Baths
1,140
Sq Ft
$1,132/Sq Ft
Est. Value
About This Home
This home is located at 620 Donner Ave, Sonoma, CA 95476 and is currently estimated at $1,290,777, approximately $1,132 per square foot. 620 Donner Ave is a home located in Sonoma County with nearby schools including Prestwood Elementary School, Adele Harrison Middle School, and Creekside High School.
Ownership History
Date
Name
Owned For
Owner Type
Purchase Details
Closed on
May 10, 2016
Sold by
Duvall Dian and Shick Raymond N
Bought by
R & D Properties Llc
Current Estimated Value
Purchase Details
Closed on
Jun 13, 2014
Sold by
Brochier Michael A and The Jean J Brochier & Mary J B
Bought by
Duvall Dian and Shick Raymond N
Home Financials for this Owner
Home Financials are based on the most recent Mortgage that was taken out on this home.
Original Mortgage
$512,850
Interest Rate
4.16%
Mortgage Type
New Conventional
Create a Home Valuation Report for This Property
The Home Valuation Report is an in-depth analysis detailing your home's value as well as a comparison with similar homes in the area
Home Values in the Area
Average Home Value in this Area
Purchase History
| Date | Buyer | Sale Price | Title Company |
|---|---|---|---|
| R & D Properties Llc | -- | None Available | |
| Duvall Dian | $789,000 | First American Title Company |
Source: Public Records
Mortgage History
| Date | Status | Borrower | Loan Amount |
|---|---|---|---|
| Previous Owner | Duvall Dian | $512,850 |
Source: Public Records
Tax History
| Year | Tax Paid | Tax Assessment Tax Assessment Total Assessment is a certain percentage of the fair market value that is determined by local assessors to be the total taxable value of land and additions on the property. | Land | Improvement |
|---|---|---|---|---|
| 2025 | $13,205 | $1,070,281 | $772,286 | $297,995 |
| 2024 | $13,205 | $1,049,296 | $757,144 | $292,152 |
| 2023 | $13,205 | $1,028,723 | $742,299 | $286,424 |
| 2022 | $12,647 | $1,008,553 | $727,745 | $280,808 |
| 2021 | $12,620 | $988,778 | $713,476 | $275,302 |
| 2020 | $12,654 | $978,641 | $706,161 | $272,480 |
| 2019 | $12,374 | $959,453 | $692,315 | $267,138 |
| 2018 | $11,990 | $940,641 | $678,741 | $261,900 |
| 2017 | $11,709 | $922,198 | $665,433 | $256,765 |
| 2016 | $11,398 | $904,117 | $652,386 | $251,731 |
| 2015 | $9,777 | $804,253 | $642,587 | $161,666 |
| 2014 | $2,294 | $120,404 | $30,141 | $90,263 |
Source: Public Records
Map
Nearby Homes
Your Personal Tour Guide
Ask me questions while you tour the home.