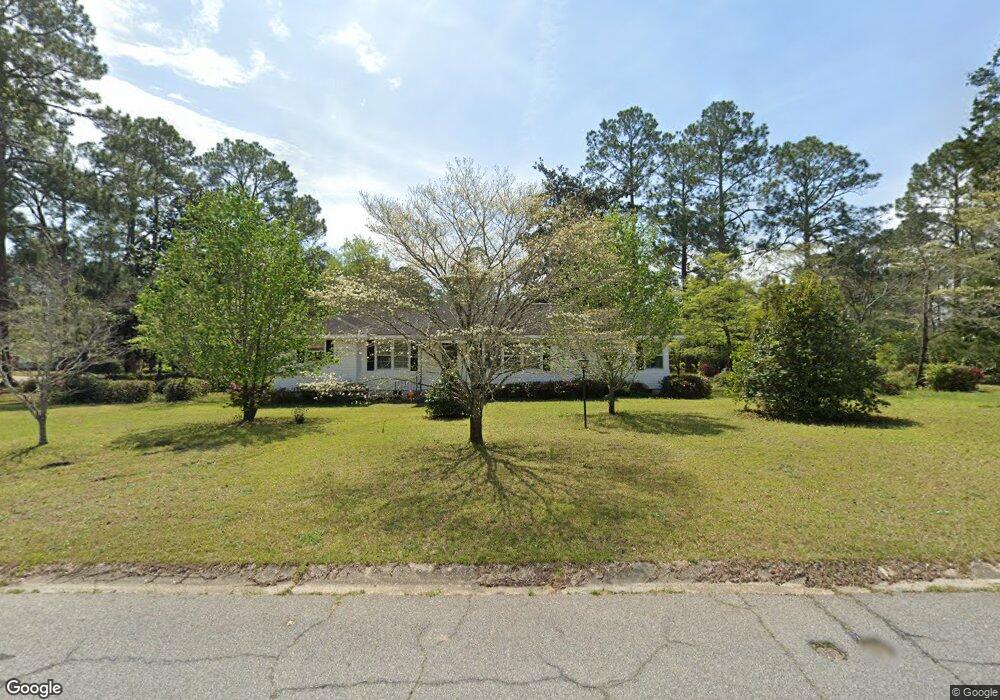
620 E 21st Ave Cordele, GA 31015
Estimated Value: $470,917 - $578,000
2
Beds
4
Baths
1,785
Sq Ft
$307/Sq Ft
Est. Value
About This Home
This home is located at 620 E 21st Ave, Cordele, GA 31015 and is currently estimated at $547,229, approximately $306 per square foot. 620 E 21st Ave is a home located in Crisp County with nearby schools including Crisp County Elementary School, Crisp County Primary School, and Crisp County Middle School.
Ownership History
Date
Name
Owned For
Owner Type
Purchase Details
Closed on
Jun 24, 2020
Sold by
Henderson Elizabeth Lee Mooney
Bought by
Griswold Michael D
Current Estimated Value
Home Financials for this Owner
Home Financials are based on the most recent Mortgage that was taken out on this home.
Original Mortgage
$390,600
Outstanding Balance
$344,033
Interest Rate
3.1%
Mortgage Type
New Conventional
Estimated Equity
$203,196
Purchase Details
Closed on
Apr 7, 2009
Sold by
Mooney Richard Gordon
Bought by
Mooney Richard G and Henderson Elizabeth Lee Mooney
Purchase Details
Closed on
Mar 22, 1985
Sold by
Robbins Luther
Bought by
Mooney Richard G
Purchase Details
Closed on
Jan 1, 1967
Sold by
Wrigth George P
Bought by
Robbins Luther
Create a Home Valuation Report for This Property
The Home Valuation Report is an in-depth analysis detailing your home's value as well as a comparison with similar homes in the area
Purchase History
| Date | Buyer | Sale Price | Title Company |
|---|---|---|---|
| Griswold Michael D | $434,000 | -- | |
| Mooney Richard G | -- | -- | |
| Henderson Elizabeth Lee Mooney | -- | -- | |
| Mooney Richard G | $13,000 | -- | |
| Robbins Luther | -- | -- |
Source: Public Records
Mortgage History
| Date | Status | Borrower | Loan Amount |
|---|---|---|---|
| Open | Griswold Michael D | $390,600 |
Source: Public Records
Tax History
| Year | Tax Paid | Tax Assessment Tax Assessment Total Assessment is a certain percentage of the fair market value that is determined by local assessors to be the total taxable value of land and additions on the property. | Land | Improvement |
|---|---|---|---|---|
| 2025 | $3,914 | $147,629 | $63,731 | $83,898 |
| 2024 | $3,786 | $139,838 | $63,731 | $76,107 |
| 2023 | $3,443 | $122,615 | $63,731 | $58,884 |
| 2022 | $2,912 | $103,696 | $47,798 | $55,898 |
| 2021 | $2,826 | $95,310 | $47,798 | $47,512 |
| 2020 | $2,743 | $92,350 | $47,798 | $44,552 |
| 2019 | $2,725 | $92,350 | $47,798 | $44,552 |
| 2018 | $2,016 | $65,820 | $24,662 | $41,158 |
| 2017 | $2,024 | $65,820 | $24,662 | $41,158 |
| 2016 | $2,021 | $65,820 | $24,662 | $41,158 |
| 2015 | -- | $65,820 | $24,662 | $41,158 |
| 2014 | -- | $65,820 | $24,662 | $41,158 |
| 2013 | -- | $65,820 | $24,662 | $41,157 |
Source: Public Records
Map
Nearby Homes
Your Personal Tour Guide
Ask me questions while you tour the home.