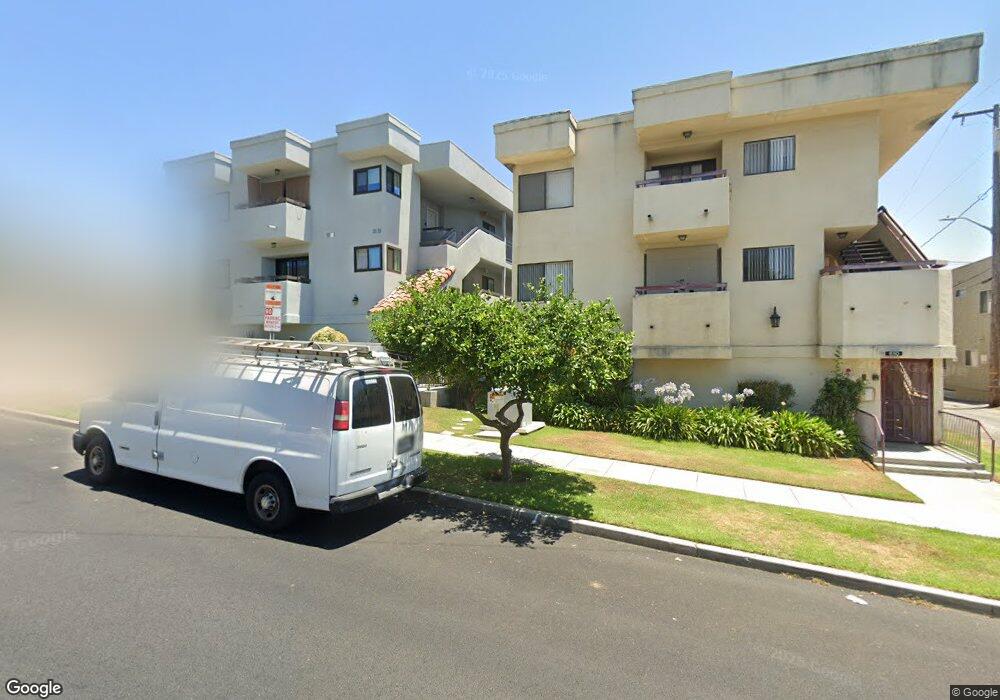
620 E Harvard Rd Unit F Burbank, CA 91501
Hillside District NeighborhoodEstimated Value: $610,462 - $668,000
2
Beds
2
Baths
975
Sq Ft
$659/Sq Ft
Est. Value
About This Home
This home is located at 620 E Harvard Rd Unit F, Burbank, CA 91501 and is currently estimated at $642,866, approximately $659 per square foot. 620 E Harvard Rd Unit F is a home located in Los Angeles County with nearby schools including Ralph Emerson Elementary School, John Muir Middle School, and Burbank High School.
Ownership History
Date
Name
Owned For
Owner Type
Purchase Details
Closed on
Jul 25, 2008
Sold by
Herron Victoria C
Bought by
Melikyan Ani
Current Estimated Value
Home Financials for this Owner
Home Financials are based on the most recent Mortgage that was taken out on this home.
Original Mortgage
$263,500
Outstanding Balance
$172,898
Interest Rate
6.41%
Mortgage Type
Purchase Money Mortgage
Estimated Equity
$469,968
Purchase Details
Closed on
Dec 13, 2002
Sold by
Herron Richard L
Bought by
Herron Victoria C
Home Financials for this Owner
Home Financials are based on the most recent Mortgage that was taken out on this home.
Original Mortgage
$174,400
Interest Rate
5.96%
Purchase Details
Closed on
Nov 22, 2002
Sold by
Namavar Ali and Namavar Alexandra
Bought by
Herron Victoria C
Home Financials for this Owner
Home Financials are based on the most recent Mortgage that was taken out on this home.
Original Mortgage
$174,400
Interest Rate
5.96%
Create a Home Valuation Report for This Property
The Home Valuation Report is an in-depth analysis detailing your home's value as well as a comparison with similar homes in the area
Home Values in the Area
Average Home Value in this Area
Purchase History
| Date | Buyer | Sale Price | Title Company |
|---|---|---|---|
| Melikyan Ani | $310,000 | Commonwealth Land Title Co | |
| Herron Victoria C | -- | Commonwealth | |
| Herron Victoria C | $218,000 | Commonwealth |
Source: Public Records
Mortgage History
| Date | Status | Borrower | Loan Amount |
|---|---|---|---|
| Open | Melikyan Ani | $263,500 | |
| Previous Owner | Herron Victoria C | $174,400 | |
| Closed | Herron Victoria C | $21,800 |
Source: Public Records
Tax History
| Year | Tax Paid | Tax Assessment Tax Assessment Total Assessment is a certain percentage of the fair market value that is determined by local assessors to be the total taxable value of land and additions on the property. | Land | Improvement |
|---|---|---|---|---|
| 2025 | $4,422 | $399,189 | $244,021 | $155,168 |
| 2024 | $4,422 | $391,363 | $239,237 | $152,126 |
| 2023 | $4,375 | $383,691 | $234,547 | $149,144 |
| 2022 | $4,175 | $376,169 | $229,949 | $146,220 |
| 2021 | $4,157 | $368,794 | $225,441 | $143,353 |
| 2019 | $3,988 | $357,857 | $218,755 | $139,102 |
| 2018 | $3,958 | $350,841 | $214,466 | $136,375 |
| 2016 | $3,755 | $337,219 | $206,139 | $131,080 |
| 2015 | $3,679 | $332,155 | $203,043 | $129,112 |
| 2014 | $3,672 | $325,649 | $199,066 | $126,583 |
Source: Public Records
Map
Nearby Homes
- 610 E Harvard Rd Unit 7
- 615 E Magnolia Blvd
- 637 E Fairmount Rd
- 441 E San Jose Ave Unit 111
- 718 E Walnut Ave
- 330 N 5th St
- 815 E Magnolia Blvd
- 436 E Palm Ave Unit 301
- 902 E Walnut Ave
- 626 E Orange Grove Ave Unit 204
- 427 E Orange Grove Ave Unit 301
- 615 E Olive Ave Unit A
- 621 E Olive Ave Unit 106
- 900 E Palm Ave
- 227 E Burbank Blvd Unit C
- 1025 E San Jose Ave
- 470 E Angeleno Ave
- 723 E Tujunga Ave
- 250 N First St Unit 321
- 250 N First St Unit 415
- 620 E Harvard Rd Unit G
- 620 E Harvard Rd Unit K
- 620 E Harvard Rd Unit E
- 620 E Harvard Rd Unit D
- 620 E Harvard Rd Unit B
- 620 E Harvard Rd Unit A
- 624 E Harvard Rd Unit B
- 624 E Harvard Rd
- 610 E Harvard Rd Unit F
- 610 E Harvard Rd
- 610 E Harvard Rd Unit D
- 610 E Harvard Rd Unit E
- 610 E Harvard Rd Unit G
- 610 E Harvard Rd Unit B
- 610 E Harvard Rd Unit 9
- 610 E Harvard Rd Unit 8
- 610 E Harvard Rd Unit 6
- 610 E Harvard Rd Unit 5
- 610 E Harvard Rd Unit 4
- 610 E Harvard Rd Unit 3
Your Personal Tour Guide
Ask me questions while you tour the home.