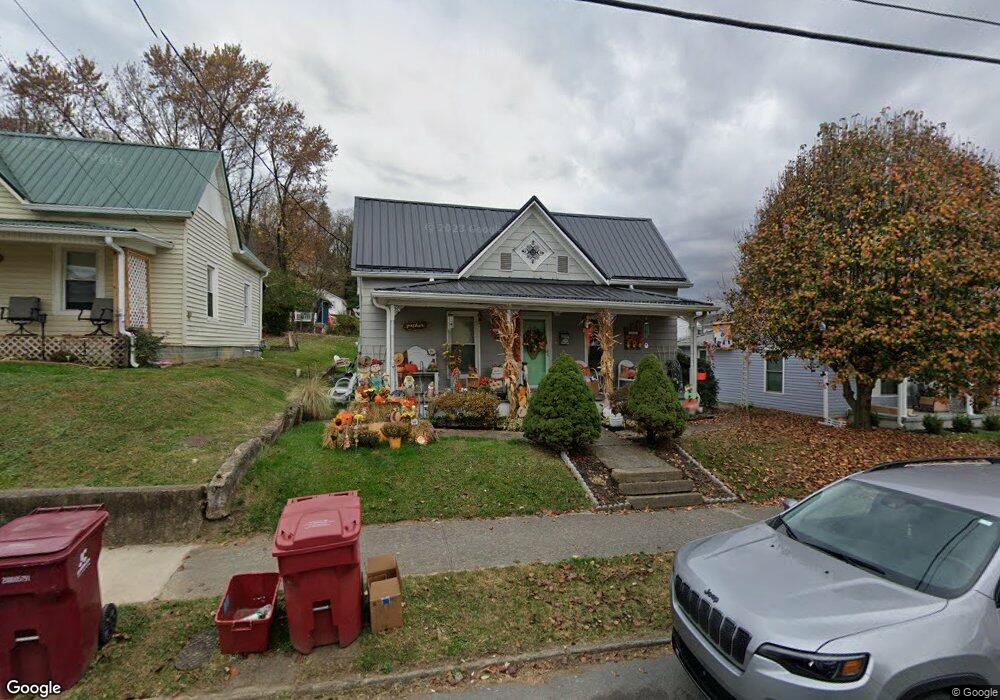
620 E Maple St Johnson City, TN 37601
Estimated Value: $152,509 - $168,000
2
Beds
1
Bath
832
Sq Ft
$189/Sq Ft
Est. Value
About This Home
This home is located at 620 E Maple St, Johnson City, TN 37601 and is currently estimated at $157,627, approximately $189 per square foot. 620 E Maple St is a home located in Washington County with nearby schools including Mountain View Elementary School, Indian Trail Middle School, and Science Hill High School.
Ownership History
Date
Name
Owned For
Owner Type
Purchase Details
Closed on
May 11, 2007
Sold by
Tolley Joseph K
Bought by
Bawgus Christopher David
Current Estimated Value
Home Financials for this Owner
Home Financials are based on the most recent Mortgage that was taken out on this home.
Original Mortgage
$62,000
Outstanding Balance
$36,968
Interest Rate
6.17%
Estimated Equity
$120,659
Purchase Details
Closed on
Sep 5, 2000
Sold by
Armstrong Vickie Sholes
Bought by
Tolley Joseph K
Purchase Details
Closed on
May 19, 1998
Sold by
Blevins Renee R
Bought by
Armstrong Vickie
Purchase Details
Closed on
Oct 15, 1997
Sold by
Elrod Barbara
Bought by
Blevins Renee
Home Financials for this Owner
Home Financials are based on the most recent Mortgage that was taken out on this home.
Original Mortgage
$16,705
Interest Rate
7.39%
Purchase Details
Closed on
Jul 28, 1982
Bought by
Miller J D J and Miller Crecia
Create a Home Valuation Report for This Property
The Home Valuation Report is an in-depth analysis detailing your home's value as well as a comparison with similar homes in the area
Purchase History
| Date | Buyer | Sale Price | Title Company |
|---|---|---|---|
| Bawgus Christopher David | $63,000 | -- | |
| Tolley Joseph K | $40,000 | -- | |
| Armstrong Vickie | $39,900 | -- | |
| Blevins Renee | $20,000 | -- | |
| Miller J D J | $6,500 | -- |
Source: Public Records
Mortgage History
| Date | Status | Borrower | Loan Amount |
|---|---|---|---|
| Open | Miller J D J | $62,000 | |
| Previous Owner | Miller J D J | $16,705 |
Source: Public Records
Tax History
| Year | Tax Paid | Tax Assessment Tax Assessment Total Assessment is a certain percentage of the fair market value that is determined by local assessors to be the total taxable value of land and additions on the property. | Land | Improvement |
|---|---|---|---|---|
| 2025 | $603 | $35,250 | $4,450 | $30,800 |
| 2024 | $603 | $35,250 | $4,450 | $30,800 |
| 2022 | $335 | $15,600 | $3,900 | $11,700 |
| 2021 | $605 | $15,600 | $3,900 | $11,700 |
| 2020 | $602 | $15,600 | $3,900 | $11,700 |
| 2019 | $315 | $15,600 | $3,900 | $11,700 |
| 2018 | $565 | $13,225 | $2,000 | $11,225 |
| 2017 | $565 | $13,225 | $2,000 | $11,225 |
| 2016 | $562 | $13,225 | $2,000 | $11,225 |
| 2015 | $509 | $13,225 | $2,000 | $11,225 |
| 2014 | $465 | $12,925 | $2,000 | $10,925 |
Source: Public Records
Map
Nearby Homes
- 630 E Maple St
- 1101 Afton St
- 32 Taylor Ridge Ct
- 411 E Chestnut St
- 900 Grover St
- 805 E Maple St
- 212 Young St
- 102 W Maple St
- 116 W Poplar St
- 1007 Spring St
- 505 Orleans St
- Tbd Orleans St
- 1106 Fremont Dr
- 1707 Daytona Dr
- 1704 Orlando Dr
- 106 Water St
- 116 Tipton St Unit 209
- 116 Tipton St Unit 304
- 300 Peach Blossom Ct
- 1008 Earnest St
Your Personal Tour Guide
Ask me questions while you tour the home.