Estimated Value: $146,000 - $199,826
4
Beds
2
Baths
2,069
Sq Ft
$87/Sq Ft
Est. Value
About This Home
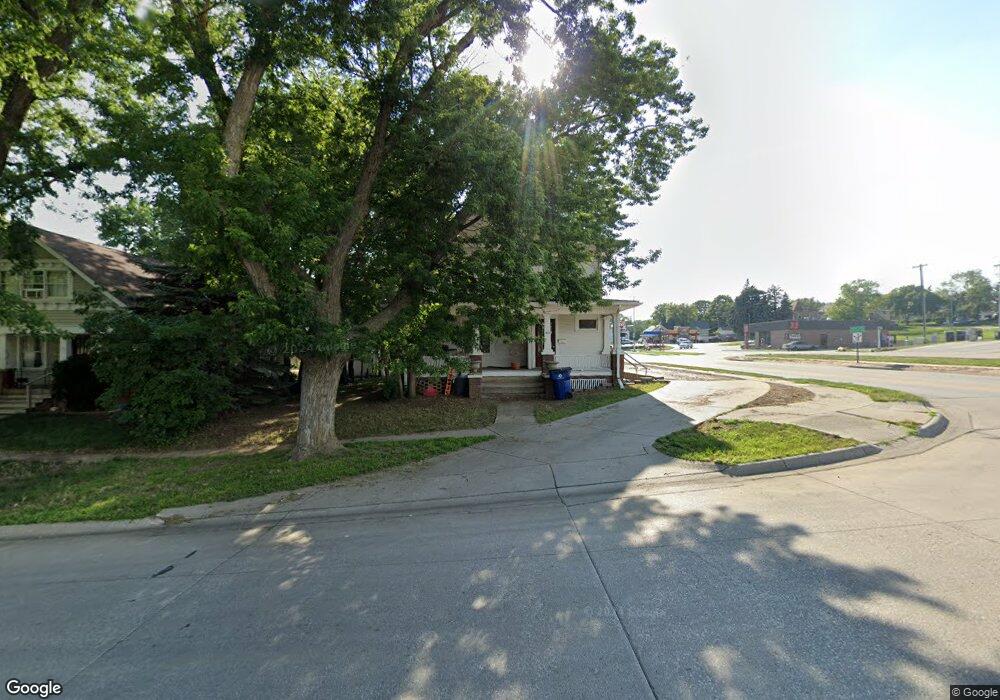
This home is located at 620 Logan St, Wayne, NE 68787 and is currently estimated at $179,957, approximately $86 per square foot. 620 Logan St is a home located in Wayne County with nearby schools including Wayne Elementary School, Wayne High School, and St. Mary Elementary School.
Ownership History
Date
Name
Owned For
Owner Type
Purchase Details
Closed on
Nov 10, 2011
Sold by
Frey Carlos L
Bought by
Brogie Edwin M and Brogie Leeann
Current Estimated Value
Home Financials for this Owner
Home Financials are based on the most recent Mortgage that was taken out on this home.
Original Mortgage
$220,389
Outstanding Balance
$150,719
Interest Rate
4.08%
Mortgage Type
Construction
Estimated Equity
$29,238
Purchase Details
Closed on
May 23, 2003
Sold by
Frey Sherian L
Bought by
Frey Carlos L
Create a Home Valuation Report for This Property
The Home Valuation Report is an in-depth analysis detailing your home's value as well as a comparison with similar homes in the area
Home Values in the Area
Average Home Value in this Area
Purchase History
| Date | Buyer | Sale Price | Title Company |
|---|---|---|---|
| Brogie Edwin M | $82,000 | -- | |
| Frey Carlos L | $5,333 | -- |
Source: Public Records
Mortgage History
| Date | Status | Borrower | Loan Amount |
|---|---|---|---|
| Open | Brogie Edwin M | $220,389 |
Source: Public Records
Tax History
| Year | Tax Paid | Tax Assessment Tax Assessment Total Assessment is a certain percentage of the fair market value that is determined by local assessors to be the total taxable value of land and additions on the property. | Land | Improvement |
|---|---|---|---|---|
| 2025 | $1,830 | $149,790 | $14,025 | $135,765 |
| 2024 | $1,830 | $145,310 | $9,790 | $135,520 |
| 2023 | $2,299 | $135,185 | $9,790 | $125,395 |
| 2022 | $2,055 | $117,770 | $9,790 | $107,980 |
| 2021 | $1,943 | $106,545 | $9,790 | $96,755 |
| 2020 | $1,906 | $106,545 | $9,790 | $96,755 |
| 2019 | $1,734 | $98,295 | $9,790 | $88,505 |
| 2018 | $1,762 | $98,295 | $9,790 | $88,505 |
| 2017 | $1,750 | $98,715 | $9,790 | $88,925 |
| 2016 | $1,850 | $0 | $0 | $0 |
| 2015 | $1,808 | $98,715 | $9,790 | $88,925 |
| 2014 | -- | $98,715 | $9,790 | $88,925 |
| 2013 | -- | $98,715 | $9,790 | $88,925 |
Source: Public Records
Map
Nearby Homes
Your Personal Tour Guide
Ask me questions while you tour the home.