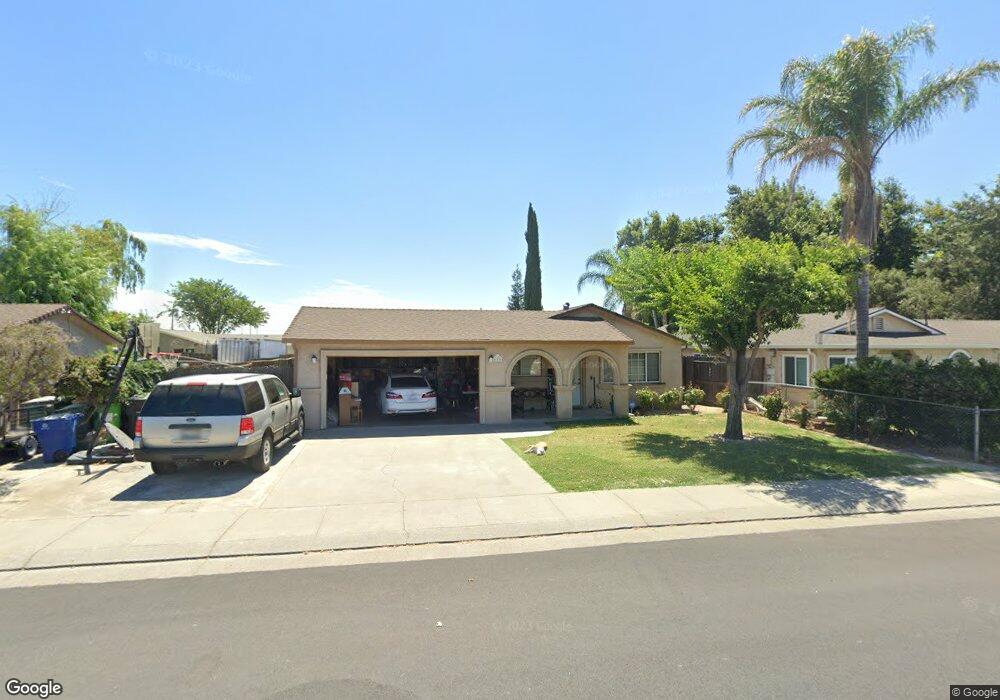
620 Mingo Way Lathrop, CA 95330
East Lathrop NeighborhoodEstimated Value: $335,000 - $629,000
3
Beds
2
Baths
1,144
Sq Ft
$390/Sq Ft
Est. Value
About This Home
This home is located at 620 Mingo Way, Lathrop, CA 95330 and is currently estimated at $446,636, approximately $390 per square foot. 620 Mingo Way is a home located in San Joaquin County with nearby schools including Lathrop Elementary School, Lathrop High School, and BE.TECH Charter High School.
Ownership History
Date
Name
Owned For
Owner Type
Purchase Details
Closed on
Feb 13, 2003
Sold by
Serrano Abraham and Serrano Jesus
Bought by
Serrano Abraham and Serrano Maria E
Current Estimated Value
Home Financials for this Owner
Home Financials are based on the most recent Mortgage that was taken out on this home.
Original Mortgage
$138,000
Outstanding Balance
$58,843
Interest Rate
5.89%
Estimated Equity
$387,793
Purchase Details
Closed on
Apr 27, 2000
Sold by
Serrano Abraham
Bought by
Serrano Abraham and Serrano Jesus
Home Financials for this Owner
Home Financials are based on the most recent Mortgage that was taken out on this home.
Original Mortgage
$71,600
Interest Rate
8.22%
Purchase Details
Closed on
Feb 25, 1998
Sold by
Brinlee Darrel R and Brinlee D
Bought by
Associates Home Equity Services Inc and Ford Consumer Finance Company Inc
Purchase Details
Closed on
Jul 25, 1997
Sold by
Brinlee Darrel R
Bought by
Brinlee Dorothy
Create a Home Valuation Report for This Property
The Home Valuation Report is an in-depth analysis detailing your home's value as well as a comparison with similar homes in the area
Home Values in the Area
Average Home Value in this Area
Purchase History
| Date | Buyer | Sale Price | Title Company |
|---|---|---|---|
| Serrano Abraham | -- | Fidelity Natl Title Ins Co | |
| Serrano Abraham | -- | Chicago Title Co | |
| Associates Home Equity Services Inc | $90,000 | North American Title Co | |
| Brinlee Dorothy | -- | -- |
Source: Public Records
Mortgage History
| Date | Status | Borrower | Loan Amount |
|---|---|---|---|
| Open | Serrano Abraham | $138,000 | |
| Closed | Serrano Abraham | $71,600 |
Source: Public Records
Tax History
| Year | Tax Paid | Tax Assessment Tax Assessment Total Assessment is a certain percentage of the fair market value that is determined by local assessors to be the total taxable value of land and additions on the property. | Land | Improvement |
|---|---|---|---|---|
| 2025 | $2,630 | $203,800 | $59,066 | $144,734 |
| 2024 | $2,673 | $199,805 | $57,908 | $141,897 |
| 2023 | $2,591 | $195,888 | $56,773 | $139,115 |
| 2022 | $2,554 | $192,048 | $55,660 | $136,388 |
| 2021 | $2,525 | $188,283 | $54,569 | $133,714 |
| 2020 | $2,435 | $186,353 | $54,010 | $132,343 |
| 2019 | $2,405 | $182,700 | $52,951 | $129,749 |
| 2018 | $2,373 | $179,118 | $51,913 | $127,205 |
| 2017 | $2,344 | $175,607 | $50,896 | $124,711 |
| 2016 | $2,292 | $172,164 | $49,898 | $122,266 |
| 2014 | $2,153 | $166,257 | $48,186 | $118,071 |
Source: Public Records
Map
Nearby Homes
- 16235 Suzie Q Ln
- 197 E Louise Ave
- 16439 Carleta Place
- 16012 Julie Ln
- 15940 Warfield Rd
- 15583 Kellogg Creek Ct
- 2150 Mulholland Dr
- 3085 Garden Farms Ave
- 2505 Mulholland Dr
- 2803 Penrose Ln
- 2281 Garden Farms Ave
- 15820 S Harlan Rd Unit 16
- 15820 S Harlan Rd Unit 98
- 15820 S Harlan Rd Unit 143
- 3104 Needham Ave
- 15810 Mckinley Ave
- 1691 Park St
- 1715 Park St
- 15150 Hollyhock Ct
- 322 Miramar Dr
Your Personal Tour Guide
Ask me questions while you tour the home.