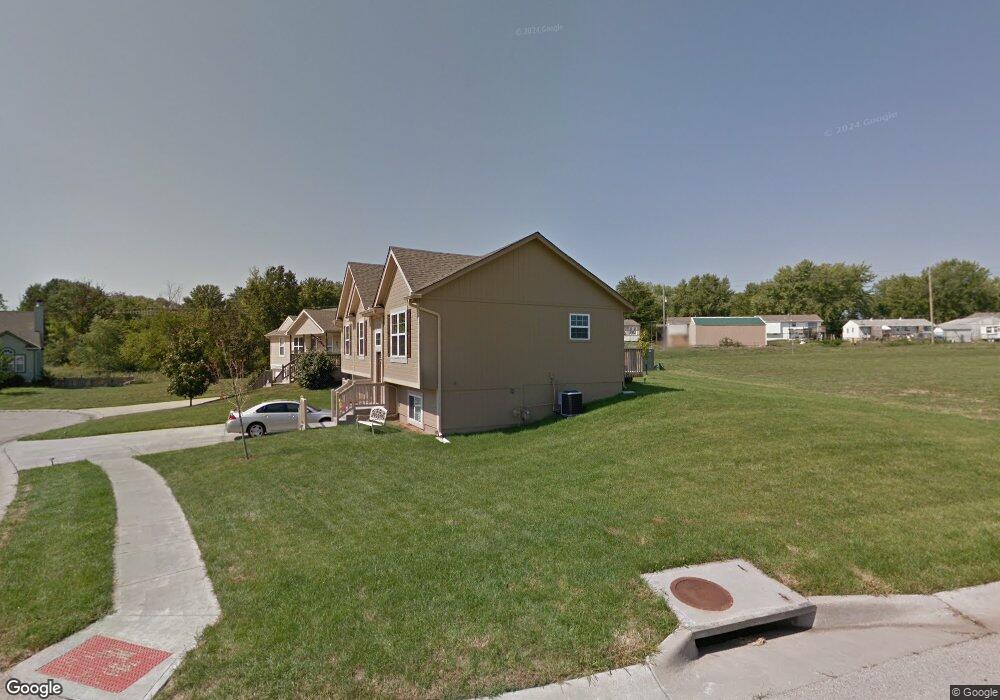
620 N Rockwell Ct Independence, MO 64056
Spring Branch NeighborhoodEstimated Value: $306,000 - $325,000
3
Beds
3
Baths
1,215
Sq Ft
$260/Sq Ft
Est. Value
About This Home
This home is located at 620 N Rockwell Ct, Independence, MO 64056 and is currently estimated at $315,721, approximately $259 per square foot. 620 N Rockwell Ct is a home located in Jackson County with nearby schools including Fort Osage High School.
Ownership History
Date
Name
Owned For
Owner Type
Purchase Details
Closed on
Dec 28, 2020
Sold by
Mccoart Derek J and Mccoart Victoria C
Bought by
Foerschler Thomas D and Spino Maria
Current Estimated Value
Home Financials for this Owner
Home Financials are based on the most recent Mortgage that was taken out on this home.
Original Mortgage
$218,500
Outstanding Balance
$194,530
Interest Rate
2.7%
Mortgage Type
New Conventional
Estimated Equity
$121,191
Purchase Details
Closed on
Feb 26, 2018
Sold by
Grubbs David and Grubbs Yvette Gray
Bought by
Mccoart Derek J
Purchase Details
Closed on
Jul 31, 2012
Sold by
Burke Homes Inc
Bought by
Grubbs David and Gray Grubbs Yvette
Home Financials for this Owner
Home Financials are based on the most recent Mortgage that was taken out on this home.
Original Mortgage
$144,730
Interest Rate
3.75%
Mortgage Type
FHA
Create a Home Valuation Report for This Property
The Home Valuation Report is an in-depth analysis detailing your home's value as well as a comparison with similar homes in the area
Home Values in the Area
Average Home Value in this Area
Purchase History
| Date | Buyer | Sale Price | Title Company |
|---|---|---|---|
| Foerschler Thomas D | -- | None Available | |
| Foerschler Thomas D | -- | None Available | |
| Mccoart Derek J | -- | Alphe Title Co Inc | |
| Mccoart Derek J | -- | Alphe Title Co Inc | |
| Grubbs David | -- | Coffelt Land Title Inc | |
| Grubbs David | -- | Coffelt Land Title Inc |
Source: Public Records
Mortgage History
| Date | Status | Borrower | Loan Amount |
|---|---|---|---|
| Open | Foerschler Thomas D | $218,500 | |
| Previous Owner | Grubbs David | $144,730 |
Source: Public Records
Tax History Compared to Growth
Tax History
| Year | Tax Paid | Tax Assessment Tax Assessment Total Assessment is a certain percentage of the fair market value that is determined by local assessors to be the total taxable value of land and additions on the property. | Land | Improvement |
|---|---|---|---|---|
| 2025 | $3,820 | $55,325 | $5,231 | $50,094 |
| 2024 | $3,802 | $48,108 | $5,483 | $42,625 |
| 2023 | $3,802 | $48,108 | $6,422 | $41,686 |
| 2022 | $3,525 | $42,370 | $5,710 | $36,660 |
| 2021 | $3,524 | $42,370 | $5,710 | $36,660 |
| 2020 | $3,132 | $37,144 | $5,710 | $31,434 |
| 2019 | $3,101 | $37,144 | $5,710 | $31,434 |
| 2018 | $1,675,463 | $31,357 | $4,586 | $26,771 |
| 2017 | $2,634 | $31,357 | $4,586 | $26,771 |
| 2016 | $2,353 | $30,571 | $2,280 | $28,291 |
| 2014 | $2,132 | $27,550 | $2,280 | $25,270 |
Source: Public Records
Map
Nearby Homes
- 301 & 401 N Jones Rd
- 658 N Mohican Dr
- 709 N Belvidere Ave
- 817 N Mohican Dr
- 810 N Cloverdale Ct
- 18900 E 6th St N
- 19610 E Bundschu Rd
- 18919 E Arrowhead Dr
- 818 N Wigwam Trail
- 18805 E Arrowhead Dr
- 18904 E Arrowhead Dr
- 507 N Geronimo Dr
- 18602 E 6th St N
- 318 N Cochise Dr
- 18505 E Bundschu Place
- 20500 E Bundschu Rd
- 1305 N Holland Dr
- 1313 N Holland Dr
- 1329 N Holland Dr
- 713 N Osage Trail
- 608 Jones Ct
- 608 N Jones Ct
- 604 Jones Ct
- 604 N Jones Ct
- 624 Rockwell Ct
- 621 Rockwell Ct
- 628 Rockwell Ct
- 600 Jones Ct
- 613 Jones Ct
- 613 N Jones Ct
- 617 N Rockwell Ct
- 617 Rockwell Ct
- 625 N Rockwell Ct
- 625 Rockwell Ct
- 601 Jones Ct
- 632 N Rockwell Ct
- 609 Jones Ct
- 632 Rockwell Ct
- 605 Jones Ct
- 629 N Rockwell Ct