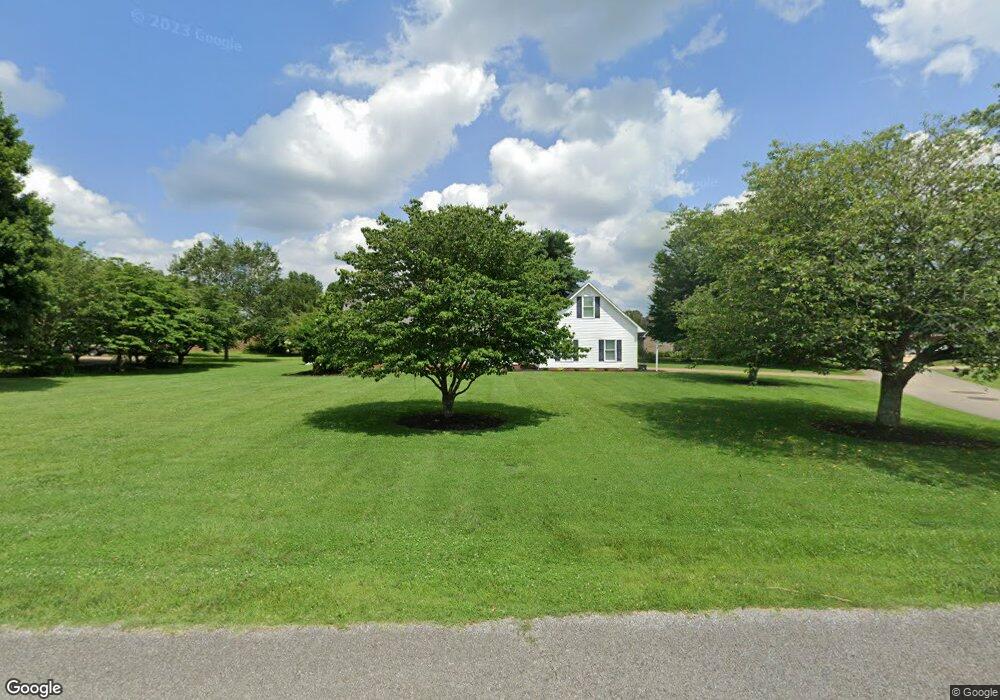
620 Red Bud Ct Lawrenceburg, TN 38464
Estimated Value: $287,023 - $383,000
--
Bed
3
Baths
1,842
Sq Ft
$186/Sq Ft
Est. Value
About This Home
This home is located at 620 Red Bud Ct, Lawrenceburg, TN 38464 and is currently estimated at $341,756, approximately $185 per square foot. 620 Red Bud Ct is a home located in Lawrence County with nearby schools including Ingram Sowell Elementary School, Lawrenceburg Public Elementary School, and David Crockett Elementary School.
Ownership History
Date
Name
Owned For
Owner Type
Purchase Details
Closed on
Feb 1, 2002
Sold by
Dorth Mark W
Bought by
Oneal Bivins Richard
Current Estimated Value
Home Financials for this Owner
Home Financials are based on the most recent Mortgage that was taken out on this home.
Original Mortgage
$90,000
Outstanding Balance
$9,137
Interest Rate
7.02%
Estimated Equity
$332,619
Purchase Details
Closed on
Aug 12, 1991
Bought by
Dorth Mark W and Dorth Donna
Purchase Details
Closed on
Feb 27, 1991
Bought by
Hanson Randall and Hanson Joanne
Purchase Details
Closed on
May 2, 1988
Bought by
Braswell Larry and Braswell Linda
Create a Home Valuation Report for This Property
The Home Valuation Report is an in-depth analysis detailing your home's value as well as a comparison with similar homes in the area
Home Values in the Area
Average Home Value in this Area
Purchase History
| Date | Buyer | Sale Price | Title Company |
|---|---|---|---|
| Oneal Bivins Richard | $112,500 | -- | |
| Dorth Mark W | $85,000 | -- | |
| Hanson Randall | $8,000 | -- | |
| Braswell Larry | -- | -- |
Source: Public Records
Mortgage History
| Date | Status | Borrower | Loan Amount |
|---|---|---|---|
| Open | Braswell Larry | $90,000 |
Source: Public Records
Tax History Compared to Growth
Tax History
| Year | Tax Paid | Tax Assessment Tax Assessment Total Assessment is a certain percentage of the fair market value that is determined by local assessors to be the total taxable value of land and additions on the property. | Land | Improvement |
|---|---|---|---|---|
| 2025 | $1,863 | $59,925 | $0 | $0 |
| 2024 | $1,863 | $59,925 | $7,500 | $52,425 |
| 2023 | $1,863 | $59,925 | $7,500 | $52,425 |
| 2022 | $1,863 | $59,925 | $7,500 | $52,425 |
| 2021 | $1,564 | $35,575 | $6,250 | $29,325 |
| 2020 | $1,564 | $35,575 | $6,250 | $29,325 |
| 2019 | $1,564 | $35,575 | $6,250 | $29,325 |
| 2018 | $1,564 | $35,575 | $6,250 | $29,325 |
| 2017 | $1,564 | $35,575 | $6,250 | $29,325 |
| 2016 | $1,564 | $35,575 | $6,250 | $29,325 |
| 2015 | $1,481 | $35,575 | $6,250 | $29,325 |
| 2014 | $1,344 | $32,300 | $5,000 | $27,300 |
Source: Public Records
Map
Nearby Homes