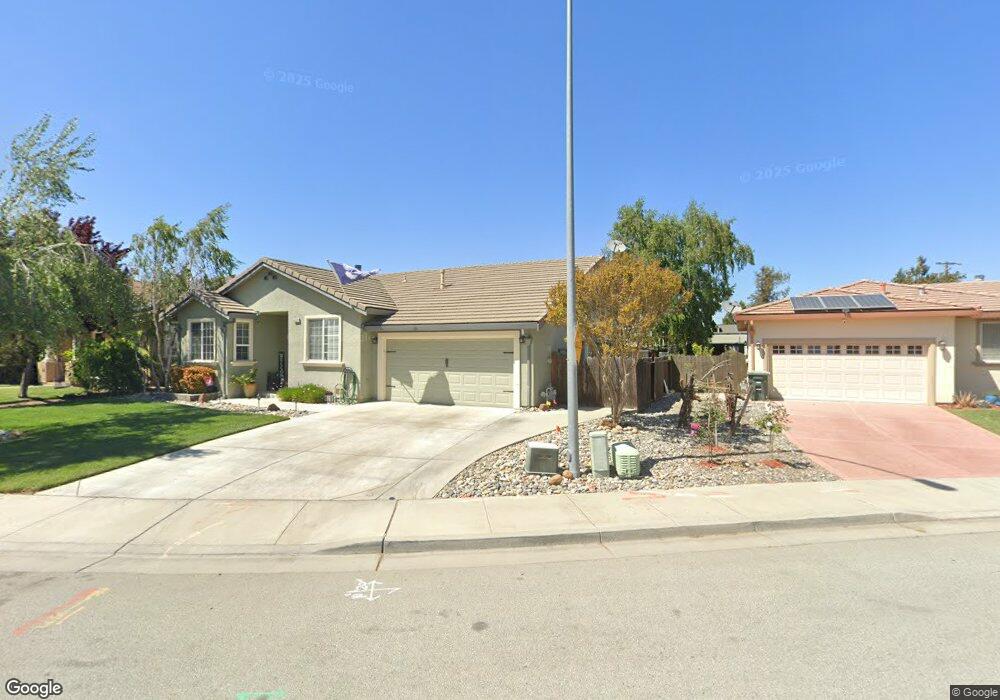
620 Vali Way Hollister, CA 95023
Estimated Value: $631,661 - $704,000
--
Bed
--
Bath
--
Sq Ft
6,098
Sq Ft Lot
About This Home
This home is located at 620 Vali Way, Hollister, CA 95023 and is currently estimated at $666,665. 620 Vali Way is a home located in San Benito County with nearby schools including R. O. Hardin Elementary School, Rancho San Justo School, and San Benito High School.
Ownership History
Date
Name
Owned For
Owner Type
Purchase Details
Closed on
Jul 20, 2015
Sold by
Mistretta Albert B and Mistretta Nancy J
Bought by
Mistretta James M and Mistretta April L
Current Estimated Value
Home Financials for this Owner
Home Financials are based on the most recent Mortgage that was taken out on this home.
Original Mortgage
$200,000
Outstanding Balance
$156,761
Interest Rate
4.01%
Mortgage Type
New Conventional
Estimated Equity
$509,904
Purchase Details
Closed on
Sep 15, 2008
Sold by
Mistretta Albert B and Mistretta Nancy J
Bought by
Mistretta Albert B and Mistretta Nancy J
Purchase Details
Closed on
Oct 19, 2001
Sold by
Alexander Sywak Md Inc
Bought by
Mistretta Albert B and Mistretta Nancy J
Home Financials for this Owner
Home Financials are based on the most recent Mortgage that was taken out on this home.
Original Mortgage
$214,200
Interest Rate
6.85%
Mortgage Type
Balloon
Create a Home Valuation Report for This Property
The Home Valuation Report is an in-depth analysis detailing your home's value as well as a comparison with similar homes in the area
Home Values in the Area
Average Home Value in this Area
Purchase History
| Date | Buyer | Sale Price | Title Company |
|---|---|---|---|
| Mistretta James M | $300,000 | Wfg National Title Ins Co | |
| Mistretta Albert B | -- | None Available | |
| Mistretta Albert B | $306,000 | San Benito Land Title Corp |
Source: Public Records
Mortgage History
| Date | Status | Borrower | Loan Amount |
|---|---|---|---|
| Open | Mistretta James M | $200,000 | |
| Previous Owner | Mistretta Albert B | $214,200 |
Source: Public Records
Tax History Compared to Growth
Tax History
| Year | Tax Paid | Tax Assessment Tax Assessment Total Assessment is a certain percentage of the fair market value that is determined by local assessors to be the total taxable value of land and additions on the property. | Land | Improvement |
|---|---|---|---|---|
| 2025 | $6,042 | $451,974 | $202,387 | $249,587 |
| 2023 | $6,042 | $434,426 | $194,529 | $239,897 |
| 2022 | $5,810 | $425,909 | $190,715 | $235,194 |
| 2021 | $5,711 | $417,559 | $186,976 | $230,583 |
| 2020 | $5,646 | $413,278 | $185,059 | $228,219 |
| 2019 | $5,560 | $405,176 | $181,431 | $223,745 |
| 2018 | $5,439 | $397,232 | $177,874 | $219,358 |
| 2017 | $5,355 | $389,444 | $174,387 | $215,057 |
| 2016 | $5,054 | $381,809 | $170,968 | $210,841 |
| 2015 | $5,000 | $376,074 | $168,400 | $207,674 |
| 2014 | $4,122 | $316,000 | $150,000 | $166,000 |
Source: Public Records
Map
Nearby Homes
- 864 Powell St
- 921 Suiter St
- 713 7th St
- 805 South St Unit 17
- 805 South St Unit 3
- 895 Monterey St
- 1010 Monterey St
- 1001 Monterey St
- 375 South St
- 900 Verissimo Ct
- 700 C St
- 720 C St
- 1075 Powell St
- 345 6th St
- 1179 San Benito St
- 601 Chaparral Ct
- 211 6th St
- 400 San Benito St Unit 202
- 400 San Benito St Unit 304
- 400 San Benito St Unit 312