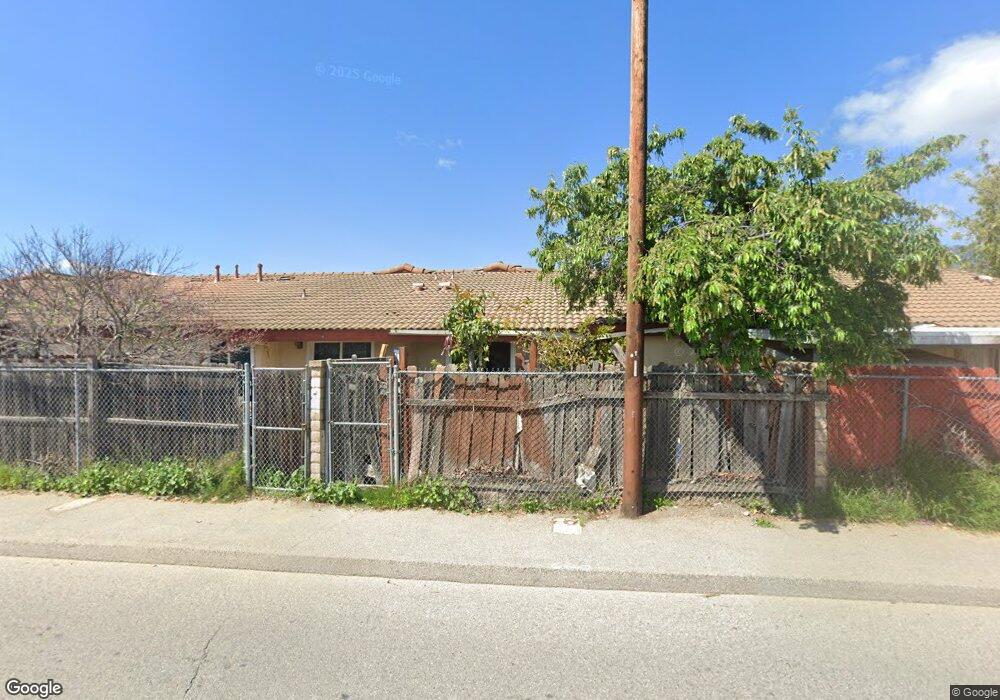
620 Via Rodeo Fillmore, CA 93015
Estimated Value: $442,337 - $479,000
1
Bed
1
Bath
862
Sq Ft
$542/Sq Ft
Est. Value
About This Home
This home is located at 620 Via Rodeo, Fillmore, CA 93015 and is currently estimated at $467,084, approximately $541 per square foot. 620 Via Rodeo is a home located in Ventura County with nearby schools including Fillmore Senior High.
Ownership History
Date
Name
Owned For
Owner Type
Purchase Details
Closed on
Mar 1, 2004
Sold by
Perez Ezequiel
Bought by
Murillo Francisco C and Murillo Evangelina C
Current Estimated Value
Home Financials for this Owner
Home Financials are based on the most recent Mortgage that was taken out on this home.
Original Mortgage
$117,000
Outstanding Balance
$54,451
Interest Rate
5.61%
Mortgage Type
Purchase Money Mortgage
Estimated Equity
$412,633
Create a Home Valuation Report for This Property
The Home Valuation Report is an in-depth analysis detailing your home's value as well as a comparison with similar homes in the area
Home Values in the Area
Average Home Value in this Area
Purchase History
| Date | Buyer | Sale Price | Title Company |
|---|---|---|---|
| Murillo Francisco C | $58,500 | National Title Company |
Source: Public Records
Mortgage History
| Date | Status | Borrower | Loan Amount |
|---|---|---|---|
| Open | Murillo Francisco C | $117,000 |
Source: Public Records
Tax History Compared to Growth
Tax History
| Year | Tax Paid | Tax Assessment Tax Assessment Total Assessment is a certain percentage of the fair market value that is determined by local assessors to be the total taxable value of land and additions on the property. | Land | Improvement |
|---|---|---|---|---|
| 2025 | $2,578 | $238,057 | $105,885 | $132,172 |
| 2024 | $2,578 | $233,390 | $103,809 | $129,581 |
| 2023 | $2,542 | $228,814 | $101,773 | $127,041 |
| 2022 | $2,348 | $224,328 | $99,778 | $124,550 |
| 2021 | $2,668 | $219,930 | $97,822 | $122,108 |
| 2020 | $2,474 | $217,677 | $96,820 | $120,857 |
| 2019 | $2,481 | $213,410 | $94,922 | $118,488 |
| 2018 | $2,430 | $209,226 | $93,061 | $116,165 |
| 2017 | $2,442 | $205,125 | $91,237 | $113,888 |
| 2016 | $1,758 | $157,000 | $69,000 | $88,000 |
| 2015 | $1,667 | $151,000 | $66,000 | $85,000 |
| 2014 | $1,412 | $126,000 | $55,000 | $71,000 |
Source: Public Records
Map
Nearby Homes