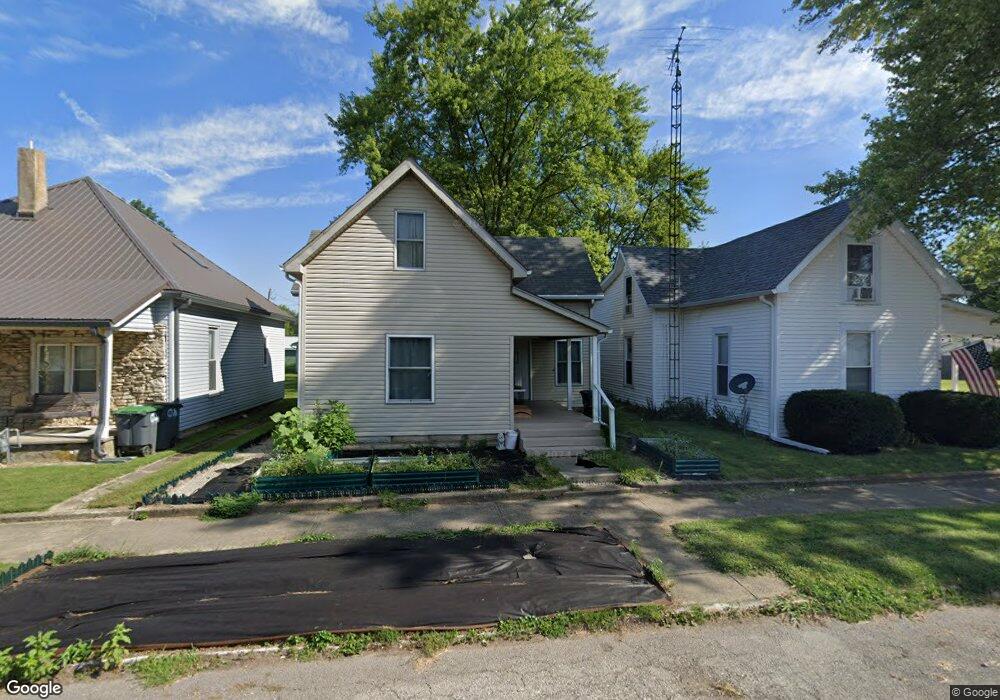
620 W 5th St Rushville, IN 46173
Estimated Value: $146,000 - $155,347
3
Beds
1
Bath
1,596
Sq Ft
$95/Sq Ft
Est. Value
About This Home
This home is located at 620 W 5th St, Rushville, IN 46173 and is currently estimated at $151,587, approximately $94 per square foot. 620 W 5th St is a home located in Rush County with nearby schools including Rushville Consolidated High School and St. Mary Catholic School.
Ownership History
Date
Name
Owned For
Owner Type
Purchase Details
Closed on
Jun 14, 2010
Sold by
Stevens Rentals Llc
Bought by
Rosario Anne M
Current Estimated Value
Home Financials for this Owner
Home Financials are based on the most recent Mortgage that was taken out on this home.
Original Mortgage
$60,327
Outstanding Balance
$40,728
Interest Rate
5.12%
Mortgage Type
FHA
Estimated Equity
$110,859
Purchase Details
Closed on
Oct 25, 2007
Sold by
Rpr Properties Llc
Bought by
Stevens Rentals Llc
Create a Home Valuation Report for This Property
The Home Valuation Report is an in-depth analysis detailing your home's value as well as a comparison with similar homes in the area
Home Values in the Area
Average Home Value in this Area
Purchase History
| Date | Buyer | Sale Price | Title Company |
|---|---|---|---|
| Rosario Anne M | -- | None Available | |
| Stevens Rentals Llc | -- | None Available |
Source: Public Records
Mortgage History
| Date | Status | Borrower | Loan Amount |
|---|---|---|---|
| Open | Rosario Anne M | $60,327 |
Source: Public Records
Tax History Compared to Growth
Tax History
| Year | Tax Paid | Tax Assessment Tax Assessment Total Assessment is a certain percentage of the fair market value that is determined by local assessors to be the total taxable value of land and additions on the property. | Land | Improvement |
|---|---|---|---|---|
| 2024 | $1,023 | $102,300 | $10,600 | $91,700 |
| 2023 | $956 | $95,400 | $10,600 | $84,800 |
| 2022 | $885 | $88,600 | $10,600 | $78,000 |
| 2021 | $767 | $76,800 | $10,600 | $66,200 |
| 2020 | $677 | $72,700 | $10,000 | $62,700 |
| 2019 | $626 | $69,300 | $10,000 | $59,300 |
| 2018 | $597 | $67,500 | $10,000 | $57,500 |
| 2017 | $554 | $65,600 | $10,000 | $55,600 |
| 2016 | $525 | $64,300 | $9,800 | $54,500 |
| 2014 | $456 | $74,300 | $10,300 | $64,000 |
| 2013 | $456 | $69,700 | $10,300 | $59,400 |
Source: Public Records
Map
Nearby Homes