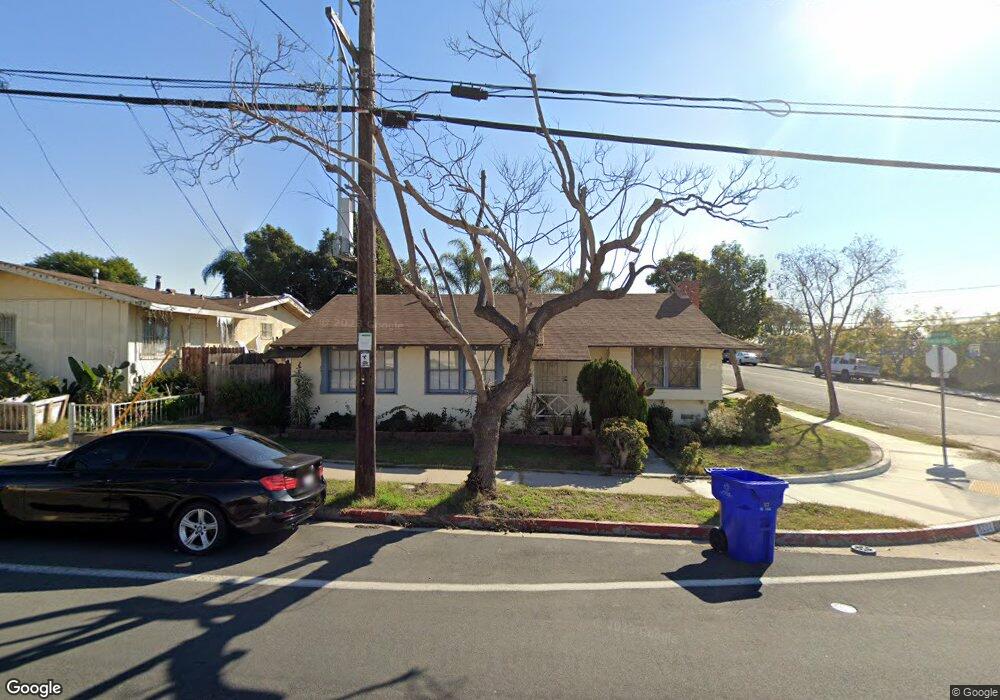
6201 Rancho Hills Dr San Diego, CA 92139
Paradise Hills NeighborhoodEstimated Value: $771,000 - $872,000
4
Beds
3
Baths
1,640
Sq Ft
$488/Sq Ft
Est. Value
About This Home
This home is located at 6201 Rancho Hills Dr, San Diego, CA 92139 and is currently estimated at $800,932, approximately $488 per square foot. 6201 Rancho Hills Dr is a home located in San Diego County with nearby schools including Bell Middle School, Morse High School, and Faithful Ambassadors Bible Baptist Academy.
Ownership History
Date
Name
Owned For
Owner Type
Purchase Details
Closed on
Dec 21, 2024
Sold by
Santos Pablito P and Santos Leonila R
Bought by
Pablito And Leonila Santos Family Trust and Santos
Current Estimated Value
Purchase Details
Closed on
Oct 26, 1994
Sold by
Vire William Russell and Hawkins Debra
Bought by
Santos Pablito P and Santos Leonila R
Home Financials for this Owner
Home Financials are based on the most recent Mortgage that was taken out on this home.
Original Mortgage
$121,201
Interest Rate
8.92%
Mortgage Type
FHA
Purchase Details
Closed on
Sep 23, 1994
Sold by
Hawkins Kenneth E
Bought by
Hawkins Debra
Home Financials for this Owner
Home Financials are based on the most recent Mortgage that was taken out on this home.
Original Mortgage
$121,201
Interest Rate
8.92%
Mortgage Type
FHA
Purchase Details
Closed on
Jan 10, 1985
Create a Home Valuation Report for This Property
The Home Valuation Report is an in-depth analysis detailing your home's value as well as a comparison with similar homes in the area
Home Values in the Area
Average Home Value in this Area
Purchase History
| Date | Buyer | Sale Price | Title Company |
|---|---|---|---|
| Pablito And Leonila Santos Family Trust | -- | None Listed On Document | |
| Santos Pablito P | $122,000 | First American Title Co | |
| Hawkins Debra | -- | Southland Title Corporation | |
| -- | $79,500 | -- |
Source: Public Records
Mortgage History
| Date | Status | Borrower | Loan Amount |
|---|---|---|---|
| Previous Owner | Santos Pablito P | $121,201 |
Source: Public Records
Tax History Compared to Growth
Tax History
| Year | Tax Paid | Tax Assessment Tax Assessment Total Assessment is a certain percentage of the fair market value that is determined by local assessors to be the total taxable value of land and additions on the property. | Land | Improvement |
|---|---|---|---|---|
| 2025 | $3,147 | $265,596 | $90,198 | $175,398 |
| 2024 | $3,147 | $260,389 | $88,430 | $171,959 |
| 2023 | $3,075 | $255,285 | $86,697 | $168,588 |
| 2022 | $2,992 | $250,281 | $84,998 | $165,283 |
| 2021 | $2,970 | $245,375 | $83,332 | $162,043 |
| 2020 | $2,934 | $242,860 | $82,478 | $160,382 |
| 2019 | $2,880 | $238,099 | $80,861 | $157,238 |
| 2018 | $2,692 | $233,431 | $79,276 | $154,155 |
| 2017 | $2,627 | $228,855 | $77,722 | $151,133 |
| 2016 | $2,582 | $224,369 | $76,199 | $148,170 |
| 2015 | $2,543 | $221,000 | $75,055 | $145,945 |
| 2014 | $2,502 | $216,672 | $73,585 | $143,087 |
Source: Public Records
Map
Nearby Homes
- 6127 Winchester St
- 3161 Manos Dr
- 2951 Manos Dr
- 2579 Reo Dr
- 2745 Kausman St
- 3044 Fleming Dr
- 2910 Lucia Jade Loop
- 5819 Roanoke St
- 2862 Callejon
- 2361 Calle Tortuosa
- 2565 Hopkins St
- 5762 Calle Sal si Puedes
- 5875 Reo Terrace Unit E
- 5875 Reo Terrace Unit C
- 5865 Reo Terrace Unit B
- 5865 Reo Terrace Unit A
- 2754 Alta View Dr
- 6755 Parkside Ave
- 2216 Calle Chanate
- 2227 Flintridge Dr
- 6209 Rancho Hills Dr
- 2721 Homedale St
- 6212 Plateau Dr
- 6217 Rancho Hills Dr
- 2695 Homedale St
- 6220 Plateau Dr
- 6225 Rancho Hills Dr
- 6212 Rancho Hills Dr
- 2692 Homedale St
- 6226 Plateau Dr
- 2675 Homedale St
- 6220 Rancho Hills Dr
- 6233 Rancho Hills Dr
- 2741 Homedale St
- 6211 Plateau Dr
- 2682 Homedale St
- 6236 Plateau Dr
- 6184 Rancho Hills Dr
- 6230 Rancho Hills Dr
- 2655 Homedale St