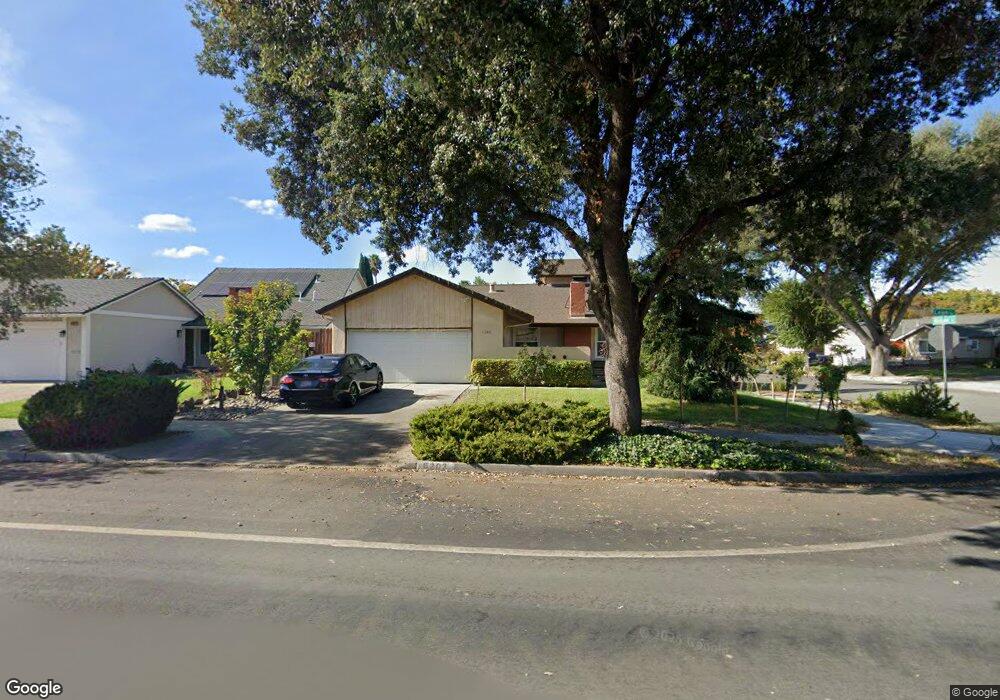
6203 Lean Ave San Jose, CA 95123
Santa Teresa Foothills NeighborhoodEstimated Value: $1,429,772 - $1,607,000
5
Beds
2
Baths
1,620
Sq Ft
$932/Sq Ft
Est. Value
About This Home
This home is located at 6203 Lean Ave, San Jose, CA 95123 and is currently estimated at $1,509,443, approximately $931 per square foot. 6203 Lean Ave is a home located in Santa Clara County with nearby schools including Bertha Taylor Elementary School, Bernal Intermediate School, and Santa Teresa High School.
Ownership History
Date
Name
Owned For
Owner Type
Purchase Details
Closed on
Jul 18, 2000
Sold by
Robert Teske and Gabi Teske
Bought by
Tang Jianshe and Li Jing
Current Estimated Value
Home Financials for this Owner
Home Financials are based on the most recent Mortgage that was taken out on this home.
Original Mortgage
$329,400
Outstanding Balance
$118,037
Interest Rate
8.25%
Estimated Equity
$1,391,406
Purchase Details
Closed on
Oct 4, 1994
Sold by
Harris Paul B and Harris Pamela R
Bought by
Teske Robert and Teske Gabi
Home Financials for this Owner
Home Financials are based on the most recent Mortgage that was taken out on this home.
Original Mortgage
$183,350
Interest Rate
8.7%
Create a Home Valuation Report for This Property
The Home Valuation Report is an in-depth analysis detailing your home's value as well as a comparison with similar homes in the area
Home Values in the Area
Average Home Value in this Area
Purchase History
| Date | Buyer | Sale Price | Title Company |
|---|---|---|---|
| Tang Jianshe | $412,000 | Old Republic Title Company | |
| Teske Robert | $193,000 | Gateway Title Company |
Source: Public Records
Mortgage History
| Date | Status | Borrower | Loan Amount |
|---|---|---|---|
| Open | Tang Jianshe | $329,400 | |
| Previous Owner | Teske Robert | $183,350 | |
| Closed | Tang Jianshe | $41,170 |
Source: Public Records
Tax History Compared to Growth
Tax History
| Year | Tax Paid | Tax Assessment Tax Assessment Total Assessment is a certain percentage of the fair market value that is determined by local assessors to be the total taxable value of land and additions on the property. | Land | Improvement |
|---|---|---|---|---|
| 2025 | $9,111 | $620,472 | $279,206 | $341,266 |
| 2024 | $9,111 | $608,307 | $273,732 | $334,575 |
| 2023 | $8,955 | $596,380 | $268,365 | $328,015 |
| 2022 | $8,887 | $584,687 | $263,103 | $321,584 |
| 2021 | $8,734 | $573,224 | $257,945 | $315,279 |
| 2020 | $8,530 | $567,348 | $255,301 | $312,047 |
| 2019 | $8,323 | $556,225 | $250,296 | $305,929 |
| 2018 | $8,257 | $545,320 | $245,389 | $299,931 |
| 2017 | $8,144 | $534,628 | $240,578 | $294,050 |
| 2016 | $7,752 | $524,146 | $235,861 | $288,285 |
| 2015 | $7,576 | $516,274 | $232,319 | $283,955 |
| 2014 | $6,832 | $506,162 | $227,769 | $278,393 |
Source: Public Records
Map
Nearby Homes