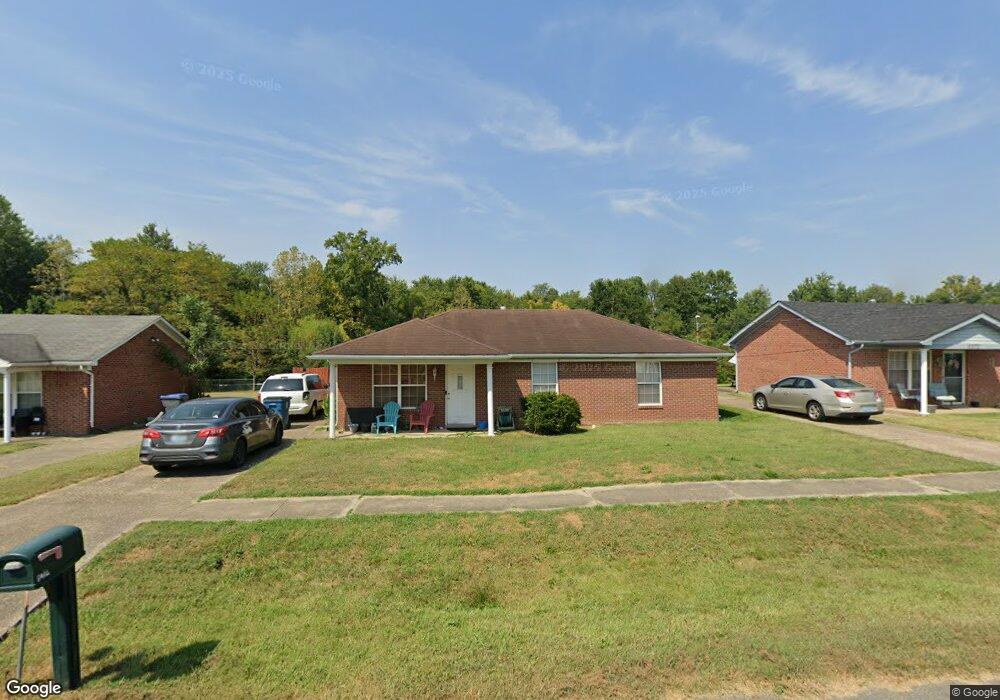
6204 Jeffrey Dr Louisville, KY 40258
Pleasure Ridge Park NeighborhoodEstimated Value: $186,000 - $233,000
3
Beds
2
Baths
1,182
Sq Ft
$171/Sq Ft
Est. Value
About This Home
This home is located at 6204 Jeffrey Dr, Louisville, KY 40258 and is currently estimated at $202,343, approximately $171 per square foot. 6204 Jeffrey Dr is a home located in Jefferson County with nearby schools including Shacklette Elementary School, Wilkerson Elementary School, and Greenwood Elementary School.
Ownership History
Date
Name
Owned For
Owner Type
Purchase Details
Closed on
Dec 21, 2020
Sold by
Fraser Mayleeann M and Brown Anthony
Bought by
Lee Fraser Jusitn Martin
Current Estimated Value
Home Financials for this Owner
Home Financials are based on the most recent Mortgage that was taken out on this home.
Original Mortgage
$117,000
Outstanding Balance
$104,351
Interest Rate
2.8%
Mortgage Type
New Conventional
Estimated Equity
$97,992
Purchase Details
Closed on
Jul 28, 2011
Sold by
Stock Yards Bank & Trust Company
Bought by
Fraser Mayleeann B
Home Financials for this Owner
Home Financials are based on the most recent Mortgage that was taken out on this home.
Original Mortgage
$76,997
Interest Rate
4.37%
Mortgage Type
FHA
Purchase Details
Closed on
Nov 2, 2010
Sold by
John Lawson Realty Co and Lawson John A
Bought by
Stock Yards Bank & Trust Company
Create a Home Valuation Report for This Property
The Home Valuation Report is an in-depth analysis detailing your home's value as well as a comparison with similar homes in the area
Home Values in the Area
Average Home Value in this Area
Purchase History
| Date | Buyer | Sale Price | Title Company |
|---|---|---|---|
| Lee Fraser Jusitn Martin | $130,000 | None Available | |
| Fraser Jusin Martin Lee | $130,000 | Agency Title | |
| Fraser Mayleeann B | $79,000 | Agency Title | |
| Stock Yards Bank & Trust Company | $67,000 | None Available |
Source: Public Records
Mortgage History
| Date | Status | Borrower | Loan Amount |
|---|---|---|---|
| Open | Fraser Jusin Martin Lee | $117,000 | |
| Closed | Fraser Jusin Martin Lee | $117,000 | |
| Previous Owner | Fraser Mayleeann B | $76,997 |
Source: Public Records
Tax History Compared to Growth
Tax History
| Year | Tax Paid | Tax Assessment Tax Assessment Total Assessment is a certain percentage of the fair market value that is determined by local assessors to be the total taxable value of land and additions on the property. | Land | Improvement |
|---|---|---|---|---|
| 2024 | $1,544 | $132,530 | $17,680 | $114,850 |
| 2023 | $1,588 | $132,530 | $17,680 | $114,850 |
| 2022 | $1,563 | $130,000 | $20,000 | $110,000 |
| 2021 | $1,675 | $130,000 | $20,000 | $110,000 |
| 2020 | $1,307 | $112,930 | $20,000 | $92,930 |
| 2019 | $1,280 | $112,930 | $20,000 | $92,930 |
| 2018 | $930 | $83,030 | $17,850 | $65,180 |
| 2017 | $871 | $83,030 | $17,850 | $65,180 |
| 2013 | $790 | $79,000 | $25,000 | $54,000 |
Source: Public Records
Map
Nearby Homes
- 6217 Jeffrey Dr
- 6423 Hunters Creek Blvd
- 5500 Terry Rd
- 6329 Hackel Dr
- 6409 Triplett Woods Dr
- 6100 Deady Dr
- 6404 Terry Rd
- 5423 Mount Holyoke Dr
- 5421 Mount Holyoke Dr
- 6501 Hackel Dr
- 5419 Mount Holyoke Dr
- 5416 Mount Holyoke Dr
- 5417 Mount Holyoke Dr
- 5707 Grandel Blvd
- 6617 Sylvania Rd
- 2514 McGee Dr
- 6647 Sylvania Rd
- 3214 Maldon Dr
- 3202 Maldon Ct
- 3200 Maldon Ct
- 6202 Jeffrey Dr
- 6206 Jeffrey Dr
- 6200 Jeffrey Dr
- 6198 Jeffrey Dr
- 6203 Jeffrey Dr
- 6205 Jeffrey Dr
- 6210 Jeffrey Dr
- 6201 Jeffrey Dr
- 6207 Jeffrey Dr
- 6199 Jeffrey Dr
- 6196 Jeffrey Dr
- 6209 Jeffrey Dr
- 6212 Jeffrey Dr
- 6197 Jeffrey Dr
- 6194 Jeffrey Dr
- 6194 Jeffrey Dr Unit Dr
- 6195 Jeffrey Dr
- 6214 Jeffrey Dr
- 6104 Terry Rd
- 6102 Terry Rd