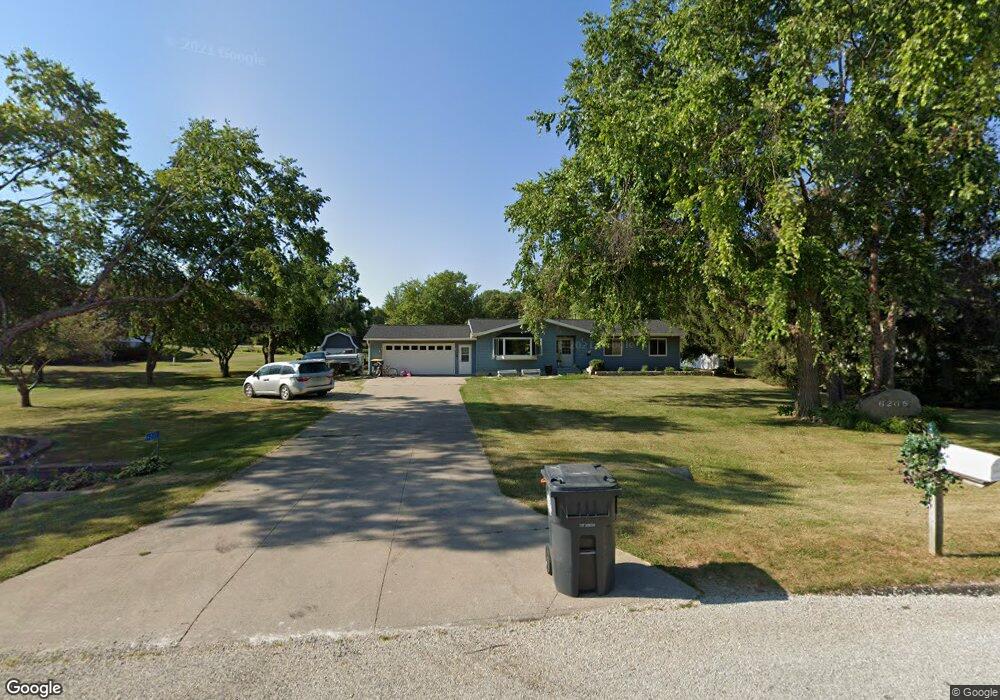
6205 Hillcrest Rd Cedar Rapids, IA 52404
Estimated Value: $309,000 - $334,000
3
Beds
2
Baths
1,329
Sq Ft
$242/Sq Ft
Est. Value
About This Home
This home is located at 6205 Hillcrest Rd, Cedar Rapids, IA 52404 and is currently estimated at $321,732, approximately $242 per square foot. 6205 Hillcrest Rd is a home located in Linn County with nearby schools including Prairie Crest Elementary School, Prairie View Elementary School, and Prairie Ridge Elementary School.
Ownership History
Date
Name
Owned For
Owner Type
Purchase Details
Closed on
Nov 19, 2018
Sold by
Uhlenkamp Virginia Ann and Lynch Patrick Michael
Bought by
Gilland Scott C
Current Estimated Value
Purchase Details
Closed on
Aug 13, 2012
Sold by
Dircks Marcia R and Dircks Marcia Rose
Bought by
Gilland Scott C and Gilland Ricki Y
Home Financials for this Owner
Home Financials are based on the most recent Mortgage that was taken out on this home.
Original Mortgage
$104,000
Interest Rate
3.62%
Mortgage Type
Adjustable Rate Mortgage/ARM
Purchase Details
Closed on
Nov 4, 1998
Sold by
Carter Daniel M and Carter Jeanne
Bought by
Dircks Herbert W and Dircks Marcia R
Home Financials for this Owner
Home Financials are based on the most recent Mortgage that was taken out on this home.
Original Mortgage
$115,200
Interest Rate
6.68%
Mortgage Type
Purchase Money Mortgage
Create a Home Valuation Report for This Property
The Home Valuation Report is an in-depth analysis detailing your home's value as well as a comparison with similar homes in the area
Home Values in the Area
Average Home Value in this Area
Purchase History
| Date | Buyer | Sale Price | Title Company |
|---|---|---|---|
| Gilland Scott C | $110,000 | None Available | |
| Gilland Scott C | $130,000 | None Available | |
| Dircks Herbert W | $143,500 | -- |
Source: Public Records
Mortgage History
| Date | Status | Borrower | Loan Amount |
|---|---|---|---|
| Previous Owner | Gilland Scott C | $104,000 | |
| Previous Owner | Dircks Herbert W | $115,200 |
Source: Public Records
Tax History Compared to Growth
Tax History
| Year | Tax Paid | Tax Assessment Tax Assessment Total Assessment is a certain percentage of the fair market value that is determined by local assessors to be the total taxable value of land and additions on the property. | Land | Improvement |
|---|---|---|---|---|
| 2025 | $3,398 | $289,800 | $65,000 | $224,800 |
| 2024 | $3,172 | $275,300 | $65,000 | $210,300 |
| 2023 | $3,172 | $275,300 | $65,000 | $210,300 |
| 2022 | $2,948 | $218,700 | $65,000 | $153,700 |
| 2021 | $2,724 | $207,200 | $65,000 | $142,200 |
| 2020 | $2,724 | $182,000 | $50,000 | $132,000 |
| 2019 | $2,530 | $170,900 | $50,000 | $120,900 |
| 2018 | $2,468 | $170,900 | $50,000 | $120,900 |
| 2017 | $2,384 | $159,900 | $50,000 | $109,900 |
| 2016 | $2,405 | $159,900 | $50,000 | $109,900 |
| 2015 | $2,394 | $159,900 | $50,000 | $109,900 |
| 2014 | $2,394 | $159,900 | $50,000 | $109,900 |
| 2013 | $2,334 | $159,900 | $50,000 | $109,900 |
Source: Public Records
Map
Nearby Homes
- 5705 Beverly Rd SW
- 315 Highland Ct
- 341 Highland Ct
- 247 Kelso Ln Unit 247
- 247 Whirlaway Ln
- 110 Skyview Ave
- 6807 Waterview Dr SW
- 3638 Stoneview Cir SW Unit 3638
- 3734 Stoneview Cir SW Unit 3734
- 4124 Lakeview Dr SW Unit 4124
- 7106 Water View Dr SW
- 7104 Waterview Dr SW
- 5901 Williams Blvd SW
- 3810 Waterview Ct SW
- 7080 Waterview Dr SW
- 7032 Waterview Dr SW Unit 7032
- 7110 Waterview Dr SW
- 6514 Fox Run Dr SW
- 7112 Water View Dr SW
- 3516 Stoneview Cir SW Unit 3516
- 4900 Valley View Dr
- 6301 Hillcrest Rd
- 6300 Meadowlark Dr
- 5000 Valley View Dr
- 6305 Hillcrest Rd
- 6206 Hillcrest Rd
- 4804 Valley View Dr
- 6300 Hillcrest Rd
- 4901 Valley View Dr
- 6400 Meadowlark Dr
- 4975 Valley View Dr
- 6401 Hillcrest Rd
- 6306 Hillcrest Rd
- 5050 Valley View Dr
- 6106 Hillcrest Rd
- 6301 Meadowlark Dr
- 6406 Meadowlark Dr
- 6401 Meadowlark Dr
- 5005 Valley View Dr
- 6402 Hillcrest Rd