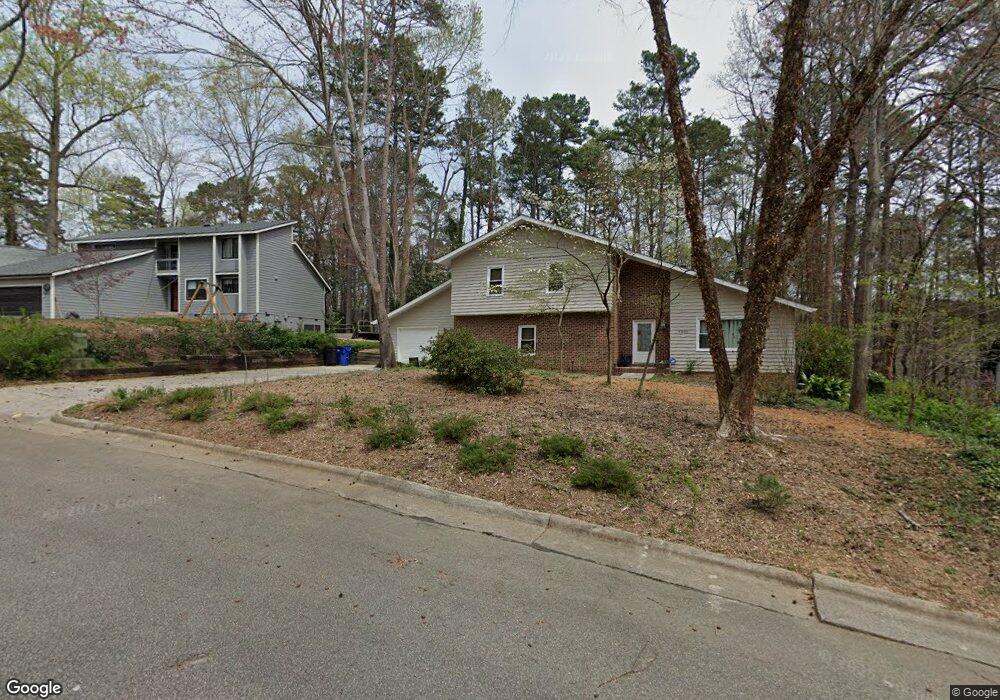
6205 Lookout Loop Raleigh, NC 27612
Estimated Value: $575,000 - $664,000
4
Beds
3
Baths
2,626
Sq Ft
$233/Sq Ft
Est. Value
About This Home
This home is located at 6205 Lookout Loop, Raleigh, NC 27612 and is currently estimated at $610,902, approximately $232 per square foot. 6205 Lookout Loop is a home located in Wake County with nearby schools including Lynn Road Elementary School, Carroll Middle, and Sanderson High School.
Ownership History
Date
Name
Owned For
Owner Type
Purchase Details
Closed on
Jul 6, 2018
Sold by
Lake James Timothy and Cardona Danielle E
Bought by
Burnett Jean Marie
Current Estimated Value
Home Financials for this Owner
Home Financials are based on the most recent Mortgage that was taken out on this home.
Original Mortgage
$316,800
Outstanding Balance
$275,162
Interest Rate
4.6%
Mortgage Type
New Conventional
Estimated Equity
$335,740
Purchase Details
Closed on
Aug 20, 2010
Sold by
Lake Alison Travers
Bought by
Lake James Timothy
Purchase Details
Closed on
Mar 7, 2008
Sold by
Frank Neil H and Frank Helen S
Bought by
Lake James T and Lake Alison T
Home Financials for this Owner
Home Financials are based on the most recent Mortgage that was taken out on this home.
Original Mortgage
$351,000
Interest Rate
5.75%
Mortgage Type
Construction
Create a Home Valuation Report for This Property
The Home Valuation Report is an in-depth analysis detailing your home's value as well as a comparison with similar homes in the area
Home Values in the Area
Average Home Value in this Area
Purchase History
| Date | Buyer | Sale Price | Title Company |
|---|---|---|---|
| Burnett Jean Marie | $396,000 | None Available. | |
| Lake James Timothy | -- | None Available | |
| Lake James T | $352,000 | None Available |
Source: Public Records
Mortgage History
| Date | Status | Borrower | Loan Amount |
|---|---|---|---|
| Open | Burnett Jean Marie | $316,800 | |
| Previous Owner | Lake James T | $351,000 |
Source: Public Records
Tax History Compared to Growth
Tax History
| Year | Tax Paid | Tax Assessment Tax Assessment Total Assessment is a certain percentage of the fair market value that is determined by local assessors to be the total taxable value of land and additions on the property. | Land | Improvement |
|---|---|---|---|---|
| 2025 | $4,613 | $526,608 | $230,000 | $296,608 |
| 2024 | $4,572 | $524,119 | $230,000 | $294,119 |
| 2023 | $3,717 | $339,140 | $110,000 | $229,140 |
| 2022 | $3,454 | $339,140 | $110,000 | $229,140 |
| 2021 | $3,320 | $339,140 | $110,000 | $229,140 |
| 2020 | $3,259 | $339,140 | $110,000 | $229,140 |
| 2019 | $2,902 | $248,710 | $95,000 | $153,710 |
| 2018 | $0 | $248,710 | $95,000 | $153,710 |
| 2017 | $2,607 | $248,710 | $95,000 | $153,710 |
| 2016 | $2,554 | $248,710 | $95,000 | $153,710 |
| 2015 | $2,540 | $243,347 | $95,000 | $148,347 |
| 2014 | $2,409 | $243,347 | $95,000 | $148,347 |
Source: Public Records
Map
Nearby Homes
- 1337 Springlawn Ct
- 6221 Rushingbrook Dr
- 1325 Springlawn Ct
- 1375 Garden Crest Cir
- 6409 Lakeland Dr
- 6404 Dixon Dr
- 1302 Springlawn Ct
- 813 Mill Greens Ct
- 5716 N Hills Dr
- 6202 Dixon Dr
- 5613 Ashton Dr
- 1500 Prisma Ct
- 1901 Longwood Dr
- 1104 Hickory Pond Ct
- 5804 Heatherbrook Cir
- 5961 Dixon Dr
- 5444 Pine Top Cir
- 6313 Ashley Ridge Dr
- 1500 Shadowood Ln
- 6025 Dixon Dr
- 6203 Lookout Loop
- 6207 Lookout Loop
- 6304 Lakeway Dr
- 6209 Lookout Loop
- 6201 Lookout Loop
- 6308 Lakeway Dr
- 6208 Lookout Loop
- 6204 Lookout Loop
- 6212 Lookout Loop
- 6211 Lookout Loop
- 6240 Lookout Loop
- 6312 Lakeway Dr
- 6236 Lookout Loop
- 6300 Lakeland Dr
- 6216 Lookout Loop
- 6232 Lookout Loop
- 6213 Lookout Loop
- 6305 Lakeway Dr
- 6316 Lakeway Dr
- 6301 Lakeland Dr