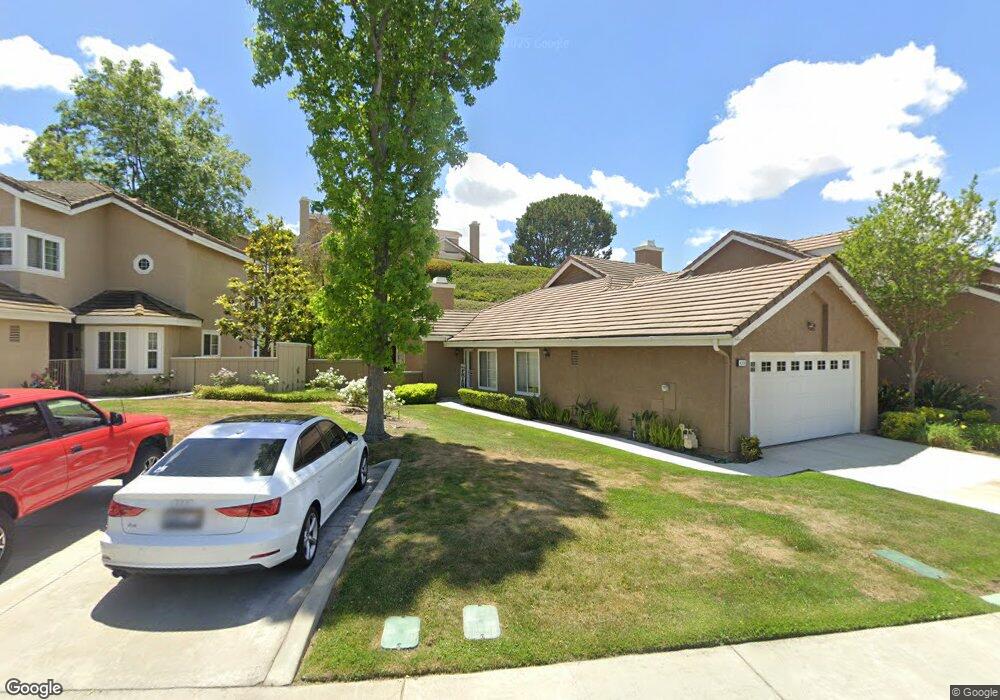
6208 E Garnet Cir Anaheim, CA 92807
Anaheim Hills NeighborhoodEstimated Value: $884,000 - $936,000
3
Beds
2
Baths
1,403
Sq Ft
$650/Sq Ft
Est. Value
About This Home
This home is located at 6208 E Garnet Cir, Anaheim, CA 92807 and is currently estimated at $911,794, approximately $649 per square foot. 6208 E Garnet Cir is a home located in Orange County with nearby schools including Imperial Elementary School, Canyon High School, and El Rancho Charter.
Ownership History
Date
Name
Owned For
Owner Type
Purchase Details
Closed on
Oct 27, 2011
Sold by
Eagle Michael Lee
Bought by
West Magna Ann and The West Family Trust
Current Estimated Value
Purchase Details
Closed on
May 22, 2002
Sold by
Eagle Lon E and Eagle Elizabeth J
Bought by
Eagle Lon and Eagle Elizabeth
Purchase Details
Closed on
Jul 5, 2001
Sold by
Schuster Laurence and Schuster Cheryl
Bought by
Eagle Lon E and Eagle Elizabeth J
Home Financials for this Owner
Home Financials are based on the most recent Mortgage that was taken out on this home.
Original Mortgage
$105,000
Interest Rate
6.99%
Purchase Details
Closed on
Aug 3, 1998
Sold by
Kincaid David and Kincaid Marguerite
Bought by
Schuster Laurence and Schuster Cheryl
Home Financials for this Owner
Home Financials are based on the most recent Mortgage that was taken out on this home.
Original Mortgage
$178,500
Interest Rate
6.88%
Mortgage Type
Balloon
Purchase Details
Closed on
Nov 20, 1995
Sold by
Saunders Freda M
Bought by
Kincaid David and Kincaid Marguerite
Home Financials for this Owner
Home Financials are based on the most recent Mortgage that was taken out on this home.
Original Mortgage
$156,750
Interest Rate
7.37%
Create a Home Valuation Report for This Property
The Home Valuation Report is an in-depth analysis detailing your home's value as well as a comparison with similar homes in the area
Home Values in the Area
Average Home Value in this Area
Purchase History
| Date | Buyer | Sale Price | Title Company |
|---|---|---|---|
| West Magna Ann | -- | None Available | |
| Eagle Lon | -- | -- | |
| Eagle Lon E | $299,000 | -- | |
| Schuster Laurence | $203,500 | Landwood Title Company | |
| Kincaid David | $165,000 | -- |
Source: Public Records
Mortgage History
| Date | Status | Borrower | Loan Amount |
|---|---|---|---|
| Previous Owner | Eagle Lon E | $105,000 | |
| Previous Owner | Schuster Laurence | $178,500 | |
| Previous Owner | Kincaid David | $156,750 |
Source: Public Records
Tax History
| Year | Tax Paid | Tax Assessment Tax Assessment Total Assessment is a certain percentage of the fair market value that is determined by local assessors to be the total taxable value of land and additions on the property. | Land | Improvement |
|---|---|---|---|---|
| 2025 | $4,969 | $441,701 | $288,025 | $153,676 |
| 2024 | $4,969 | $433,041 | $282,378 | $150,663 |
| 2023 | $4,858 | $424,550 | $276,841 | $147,709 |
| 2022 | $4,416 | $416,226 | $271,413 | $144,813 |
| 2021 | $4,289 | $408,065 | $266,091 | $141,974 |
| 2020 | $4,250 | $403,881 | $263,362 | $140,519 |
| 2019 | $4,194 | $395,962 | $258,198 | $137,764 |
| 2018 | $4,129 | $388,199 | $253,136 | $135,063 |
| 2017 | $3,951 | $380,588 | $248,173 | $132,415 |
| 2016 | $3,873 | $373,126 | $243,307 | $129,819 |
| 2015 | $3,823 | $367,522 | $239,653 | $127,869 |
| 2014 | $3,742 | $360,323 | $234,958 | $125,365 |
Source: Public Records
Map
Nearby Homes
- 783 S Ruby Ln
- 6201 E Onyx Ln
- 813 S Sapphire Ln
- 6430 E Oakview Ln
- 2463 N Eaton Ct
- 2440 N Highwood Rd
- 730 S Stillwater Ln
- 731 S Ridgeview Rd
- 720 S Ridgeview Rd
- 8124 E Cheshire Rd
- 6520 E Paseo el Greco
- 430 S Ranch View Cir Unit 10
- 6525 E Camino Vista
- 500 S Calle de Casas
- 442 S Paseo Real
- 6437 E Calle Del Norte
- 381 S Henning Way
- 868 S Calle Venado
- 8415 E Kendra Loop
- 6535 E Paseo Murillo
- 6204 E Garnet Cir
- 6212 E Garnet Cir
- 6200 E Garnet Cir
- 6216 E Garnet Cir
- 6213 E Garnet Cir
- 6209 E Garnet Cir
- 6217 E Garnet Cir
- 6205 E Garnet Cir
- 6221 E Garnet Cir
- 6201 E Garnet Cir
- 6221 E Onyx Ln
- 6225 E Garnet Cir
- 6217 E Onyx Ln
- 6224 E Garnet Cir
- 6225 E Onyx Ln
- 6130 E Garnet Cir
- 6229 E Garnet Cir
- 6124 E Garnet Cir
- 6229 E Onyx Ln
- 6213 E Onyx Ln
Your Personal Tour Guide
Ask me questions while you tour the home.