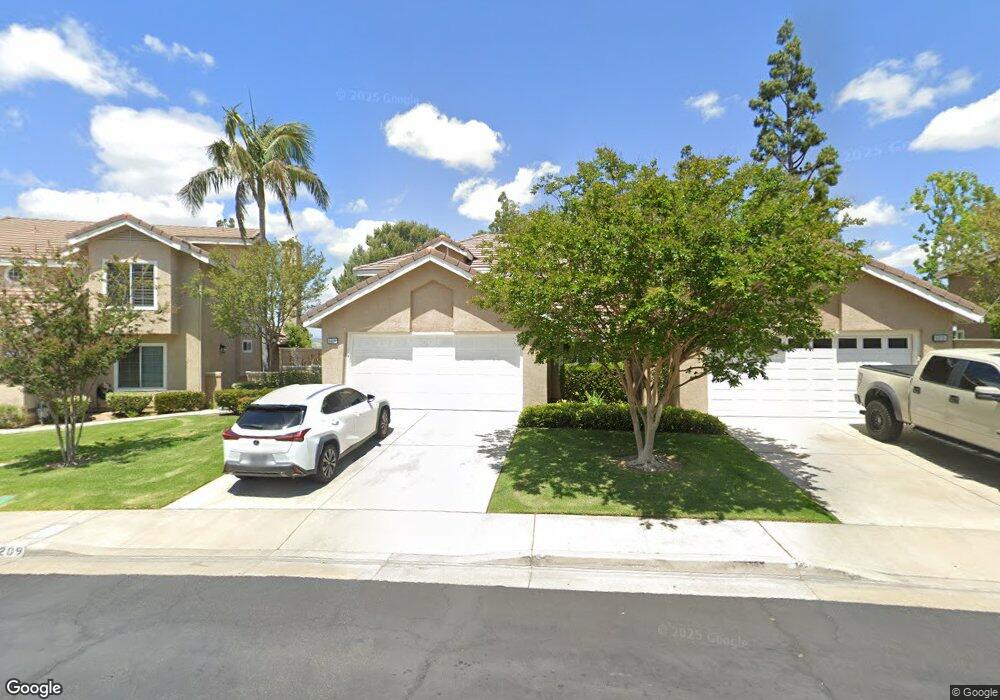
6209 E Garnet Cir Anaheim, CA 92807
Anaheim Hills NeighborhoodEstimated Value: $904,065 - $983,000
3
Beds
3
Baths
1,484
Sq Ft
$636/Sq Ft
Est. Value
About This Home
This home is located at 6209 E Garnet Cir, Anaheim, CA 92807 and is currently estimated at $944,266, approximately $636 per square foot. 6209 E Garnet Cir is a home located in Orange County with nearby schools including Imperial Elementary School, Canyon High School, and El Rancho Charter.
Ownership History
Date
Name
Owned For
Owner Type
Purchase Details
Closed on
Feb 14, 2024
Sold by
Dow Emily Eunmee
Bought by
Emily E Dow Trust and Dow
Current Estimated Value
Purchase Details
Closed on
Apr 18, 2001
Sold by
Dunwoody Robert and Dunwoody Tracie
Bought by
Dow Emily
Home Financials for this Owner
Home Financials are based on the most recent Mortgage that was taken out on this home.
Original Mortgage
$224,250
Interest Rate
6.89%
Purchase Details
Closed on
Oct 12, 1998
Sold by
Pamela Seminaro
Bought by
Dunwoody Robert and Dunwoody Tracie
Home Financials for this Owner
Home Financials are based on the most recent Mortgage that was taken out on this home.
Original Mortgage
$180,000
Interest Rate
6.54%
Purchase Details
Closed on
Nov 11, 1993
Sold by
Seminaro Mark L
Bought by
Seminaro Pamela C
Create a Home Valuation Report for This Property
The Home Valuation Report is an in-depth analysis detailing your home's value as well as a comparison with similar homes in the area
Home Values in the Area
Average Home Value in this Area
Purchase History
| Date | Buyer | Sale Price | Title Company |
|---|---|---|---|
| Emily E Dow Trust | -- | None Listed On Document | |
| Dow Emily | $299,000 | Southland Title Corporation | |
| Dunwoody Robert | $225,000 | Investors Title Company | |
| Seminaro Pamela C | -- | -- |
Source: Public Records
Mortgage History
| Date | Status | Borrower | Loan Amount |
|---|---|---|---|
| Previous Owner | Dow Emily | $224,250 | |
| Previous Owner | Dunwoody Robert | $180,000 | |
| Closed | Dunwoody Robert | $22,500 |
Source: Public Records
Tax History
| Year | Tax Paid | Tax Assessment Tax Assessment Total Assessment is a certain percentage of the fair market value that is determined by local assessors to be the total taxable value of land and additions on the property. | Land | Improvement |
|---|---|---|---|---|
| 2025 | $4,987 | $450,536 | $270,293 | $180,243 |
| 2024 | $4,987 | $441,702 | $264,993 | $176,709 |
| 2023 | $4,874 | $433,042 | $259,797 | $173,245 |
| 2022 | $4,430 | $424,551 | $254,702 | $169,849 |
| 2021 | $4,301 | $416,227 | $249,708 | $166,519 |
| 2020 | $4,261 | $411,960 | $247,148 | $164,812 |
| 2019 | $4,204 | $403,883 | $242,302 | $161,581 |
| 2018 | $4,137 | $395,964 | $237,551 | $158,413 |
| 2017 | $3,957 | $388,200 | $232,893 | $155,307 |
| 2016 | $3,878 | $380,589 | $228,327 | $152,262 |
| 2015 | $3,827 | $374,873 | $224,898 | $149,975 |
| 2014 | $3,744 | $367,530 | $220,492 | $147,038 |
Source: Public Records
Map
Nearby Homes
- 783 S Ruby Ln
- 6201 E Onyx Ln
- 813 S Sapphire Ln
- 6430 E Oakview Ln
- 2463 N Eaton Ct
- 2440 N Highwood Rd
- 730 S Stillwater Ln
- 731 S Ridgeview Rd
- 720 S Ridgeview Rd
- 8124 E Cheshire Rd
- 6520 E Paseo el Greco
- 430 S Ranch View Cir Unit 10
- 6525 E Camino Vista
- 500 S Calle de Casas
- 442 S Paseo Real
- 6437 E Calle Del Norte
- 381 S Henning Way
- 868 S Calle Venado
- 8415 E Kendra Loop
- 6535 E Paseo Murillo
- 6205 E Garnet Cir
- 6213 E Garnet Cir
- 6201 E Garnet Cir
- 6217 E Garnet Cir
- 6221 E Garnet Cir
- 6204 E Garnet Cir
- 6208 E Garnet Cir
- 6200 E Garnet Cir
- 799 S Ruby Ln
- 6212 E Garnet Cir
- 6225 E Garnet Cir
- 795 S Ruby Ln
- 730 S Tourmaline Ct
- 6216 E Garnet Cir
- 6229 E Garnet Cir
- 6153 E Garnet Cir
- 784 S Ruby Ln
- 720 S Tourmaline Ct
- 6130 E Garnet Cir
- 6233 E Garnet Cir
Your Personal Tour Guide
Ask me questions while you tour the home.