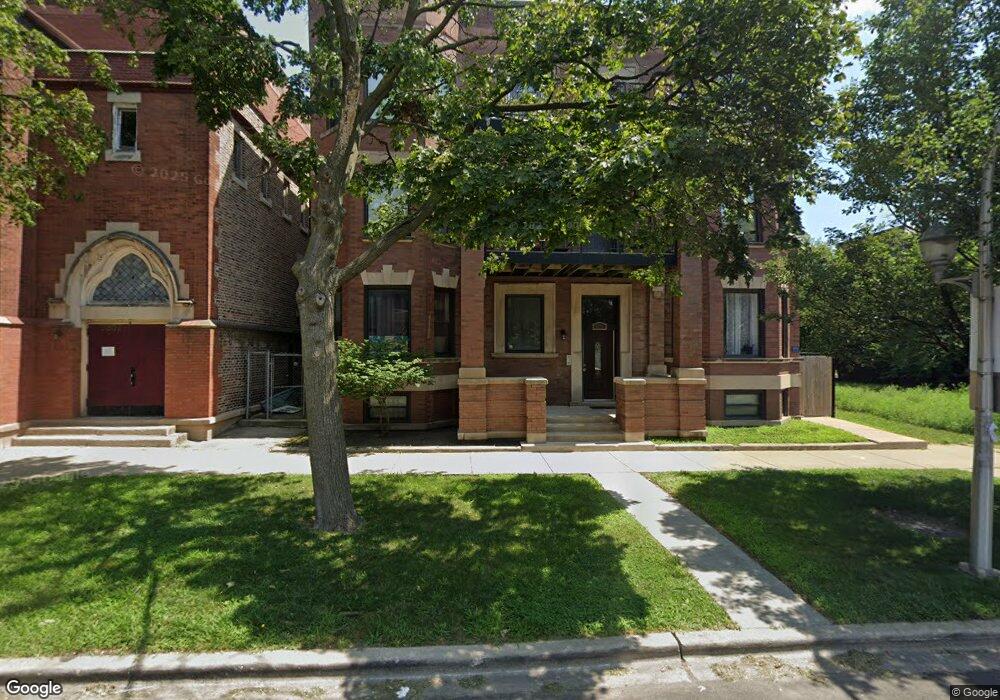
6209 S University Ave Unit 3 Chicago, IL 60637
Woodlawn NeighborhoodEstimated Value: $208,477 - $299,000
3
Beds
2
Baths
1,500
Sq Ft
$178/Sq Ft
Est. Value
About This Home
This home is located at 6209 S University Ave Unit 3, Chicago, IL 60637 and is currently estimated at $266,869, approximately $177 per square foot. 6209 S University Ave Unit 3 is a home located in Cook County with nearby schools including Fiske Elementary School, Hyde Park Academy High School, and Univ of Chicago Chtr-Woodlawn.
Ownership History
Date
Name
Owned For
Owner Type
Purchase Details
Closed on
Aug 26, 2021
Sold by
Billingsley Frances
Bought by
Billingsley Frances N and Billingsley Frances N
Current Estimated Value
Purchase Details
Closed on
Jun 7, 2019
Sold by
Mccartney William
Bought by
Billingsley Frances
Purchase Details
Closed on
Nov 19, 2008
Sold by
6209 S University Inc
Bought by
Mccartney William
Home Financials for this Owner
Home Financials are based on the most recent Mortgage that was taken out on this home.
Original Mortgage
$203,300
Interest Rate
6.04%
Mortgage Type
Unknown
Purchase Details
Closed on
Jul 27, 2006
Sold by
Harper Thomas and Harper Rosalind
Bought by
Piuian George
Home Financials for this Owner
Home Financials are based on the most recent Mortgage that was taken out on this home.
Original Mortgage
$360,000
Interest Rate
8.25%
Mortgage Type
Purchase Money Mortgage
Create a Home Valuation Report for This Property
The Home Valuation Report is an in-depth analysis detailing your home's value as well as a comparison with similar homes in the area
Home Values in the Area
Average Home Value in this Area
Purchase History
| Date | Buyer | Sale Price | Title Company |
|---|---|---|---|
| Billingsley Frances N | -- | Accommodation | |
| Billingsley Frances | $215,000 | Attorney | |
| Mccartney William | $216,000 | Pntn | |
| Piuian George | $450,000 | Pntn |
Source: Public Records
Mortgage History
| Date | Status | Borrower | Loan Amount |
|---|---|---|---|
| Previous Owner | Mccartney William | $203,300 | |
| Previous Owner | Piuian George | $360,000 |
Source: Public Records
Tax History Compared to Growth
Tax History
| Year | Tax Paid | Tax Assessment Tax Assessment Total Assessment is a certain percentage of the fair market value that is determined by local assessors to be the total taxable value of land and additions on the property. | Land | Improvement |
|---|---|---|---|---|
| 2024 | $1,065 | $19,000 | $1,056 | $17,944 |
| 2023 | $996 | $11,000 | $1,056 | $9,944 |
| 2022 | $996 | $11,000 | $1,056 | $9,944 |
| 2021 | $1,006 | $10,999 | $1,056 | $9,943 |
| 2020 | $2,213 | $15,517 | $929 | $14,588 |
| 2019 | $3,435 | $17,096 | $929 | $16,167 |
| 2018 | $1,963 | $9,935 | $929 | $9,006 |
| 2017 | $4,370 | $20,302 | $844 | $19,458 |
| 2016 | $4,066 | $20,302 | $844 | $19,458 |
| 2015 | $3,720 | $20,302 | $844 | $19,458 |
| 2014 | $6,013 | $32,406 | $696 | $31,710 |
| 2013 | $5,894 | $32,406 | $696 | $31,710 |
Source: Public Records
Map
Nearby Homes
- 6216 S Woodlawn Ave Unit F
- 6216 S Woodlawn Ave Unit A
- 6218 S Woodlawn Ave Unit B
- 6218 S Woodlawn Ave Unit A
- 6218 S Woodlawn Ave Unit H
- 6148 S Woodlawn Ave Unit 3A
- 6233 S Woodlawn Ave Unit 2
- 6821 S Harper Ave
- 1520-22 E 66th Place
- 6224 S Greenwood Ave
- 6300 S Woodlawn Ave Unit 305
- 6121 S Woodlawn Ave Unit 2
- 1127 E 61st St Unit 3
- 1167 E 61st St Unit 2
- 6109 S Greenwood Ave
- 6239 S Ellis Ave
- 6318 S Greenwood Ave Unit 1
- 6320 S Greenwood Ave Unit 2
- 6320 S Greenwood Ave Unit G
- 6123 S Ellis Ave
- 6209 S University Ave Unit 6209
- 6209 S University Ave Unit 6209
- 6209 S University Ave Unit 6209
- 6209 S University Ave Unit 1
- 6209 S University Ave Unit 3N
- 6211 S University Ave Unit 6211
- 6211 S University Ave Unit 6211
- 6211 S University Ave Unit 6211
- 6211 S University Ave Unit 3
- 6211 S University Ave Unit 1S
- 6211 S University Ave Unit 2
- 6211 S University Ave Unit 1
- 6219 S University Ave
- 6218 S University Ave Unit 1
- 6218 S University Ave Unit 3
- 6200 S University Ave Unit 8
- 6200 S University Ave
- 6231 S University Ave
- 6233 S University Ave
- 6208 S Woodlawn Ave Unit 1S