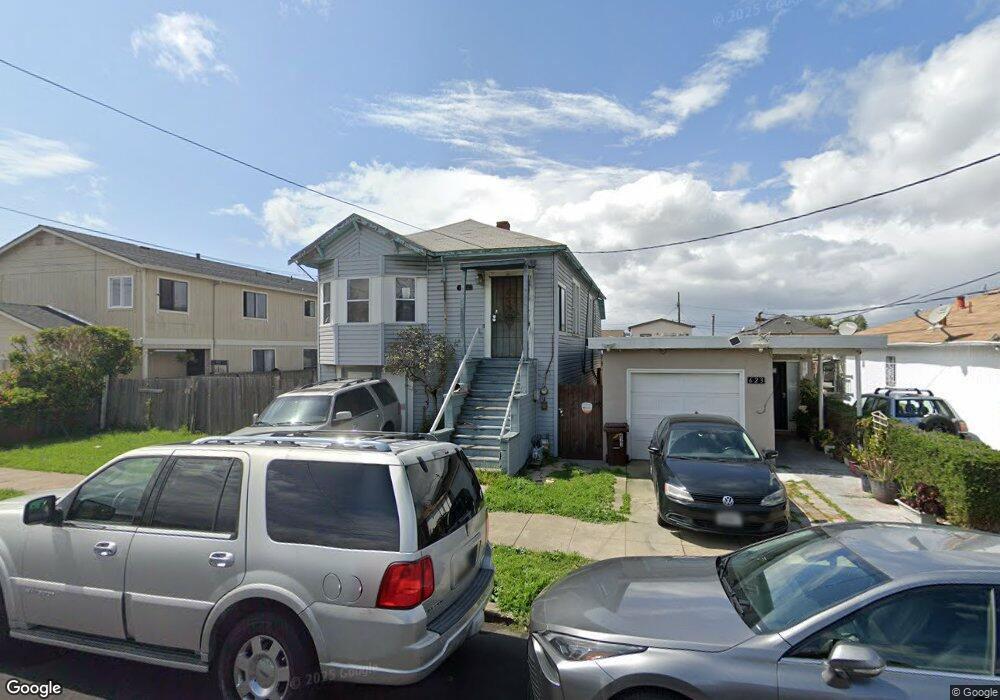
621 16th St Richmond, CA 94801
Belding Woods NeighborhoodEstimated Value: $379,059 - $469,000
3
Beds
1
Bath
906
Sq Ft
$472/Sq Ft
Est. Value
About This Home
This home is located at 621 16th St, Richmond, CA 94801 and is currently estimated at $427,765, approximately $472 per square foot. 621 16th St is a home located in Contra Costa County with nearby schools including Grant Elementary School, Lovonya DeJean Middle School, and John F. Kennedy High School.
Ownership History
Date
Name
Owned For
Owner Type
Purchase Details
Closed on
Oct 28, 2025
Sold by
Idea Law Group Pc
Bought by
B-Mused Llc
Current Estimated Value
Purchase Details
Closed on
Oct 17, 2008
Sold by
Godinez Margaret
Bought by
Godinez Margaret
Home Financials for this Owner
Home Financials are based on the most recent Mortgage that was taken out on this home.
Original Mortgage
$330,000
Interest Rate
3.49%
Mortgage Type
Reverse Mortgage Home Equity Conversion Mortgage
Create a Home Valuation Report for This Property
The Home Valuation Report is an in-depth analysis detailing your home's value as well as a comparison with similar homes in the area
Home Values in the Area
Average Home Value in this Area
Purchase History
| Date | Buyer | Sale Price | Title Company |
|---|---|---|---|
| B-Mused Llc | $316,120 | None Listed On Document | |
| Godinez Margaret | -- | First American Title Company |
Source: Public Records
Mortgage History
| Date | Status | Borrower | Loan Amount |
|---|---|---|---|
| Previous Owner | Godinez Margaret | $330,000 |
Source: Public Records
Tax History Compared to Growth
Tax History
| Year | Tax Paid | Tax Assessment Tax Assessment Total Assessment is a certain percentage of the fair market value that is determined by local assessors to be the total taxable value of land and additions on the property. | Land | Improvement |
|---|---|---|---|---|
| 2025 | $2,639 | $95,045 | $46,674 | $48,371 |
| 2024 | $2,639 | $93,182 | $45,759 | $47,423 |
| 2023 | $2,613 | $91,356 | $44,862 | $46,494 |
| 2022 | $2,525 | $89,566 | $43,983 | $45,583 |
| 2021 | $2,453 | $87,811 | $43,121 | $44,690 |
| 2019 | $2,284 | $85,208 | $41,843 | $43,365 |
| 2018 | $2,189 | $83,538 | $41,023 | $42,515 |
| 2017 | $2,115 | $81,901 | $40,219 | $41,682 |
| 2016 | $2,048 | $80,296 | $39,431 | $40,865 |
| 2015 | -- | $79,091 | $38,839 | $40,252 |
| 2014 | $1,991 | $77,543 | $38,079 | $39,464 |
Source: Public Records
Map
Nearby Homes