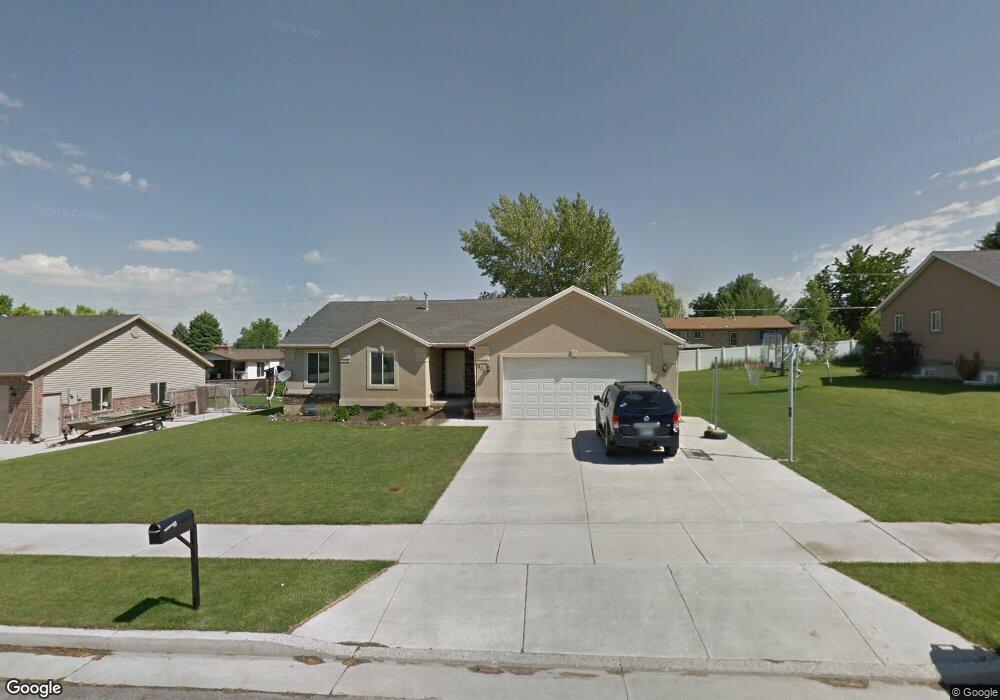
621 E 420 S Smithfield, UT 84335
Estimated Value: $453,000 - $510,000
3
Beds
2
Baths
2,522
Sq Ft
$190/Sq Ft
Est. Value
About This Home
This home is located at 621 E 420 S, Smithfield, UT 84335 and is currently estimated at $478,333, approximately $189 per square foot. 621 E 420 S is a home located in Cache County with nearby schools including Sunrise School, Cedar Ridge School, and North Cache Middle School.
Ownership History
Date
Name
Owned For
Owner Type
Purchase Details
Closed on
Aug 4, 2005
Sold by
Cendant Mobility Financial Corporation
Bought by
Yonk Josh and Yonk Kellie
Current Estimated Value
Home Financials for this Owner
Home Financials are based on the most recent Mortgage that was taken out on this home.
Original Mortgage
$7,315
Outstanding Balance
$3,814
Interest Rate
5.64%
Mortgage Type
Stand Alone Second
Estimated Equity
$474,519
Purchase Details
Closed on
Jul 18, 2005
Sold by
Gunnell Brian J and Gunnell Melanie
Bought by
Cendant Mobility Financial Corporation
Home Financials for this Owner
Home Financials are based on the most recent Mortgage that was taken out on this home.
Original Mortgage
$7,315
Outstanding Balance
$3,814
Interest Rate
5.64%
Mortgage Type
Stand Alone Second
Estimated Equity
$474,519
Create a Home Valuation Report for This Property
The Home Valuation Report is an in-depth analysis detailing your home's value as well as a comparison with similar homes in the area
Home Values in the Area
Average Home Value in this Area
Purchase History
| Date | Buyer | Sale Price | Title Company |
|---|---|---|---|
| Yonk Josh | -- | American Secure Title | |
| Cendant Mobility Financial Corporation | -- | American Secure Title |
Source: Public Records
Mortgage History
| Date | Status | Borrower | Loan Amount |
|---|---|---|---|
| Open | Yonk Josh | $7,315 | |
| Open | Yonk Josh | $166,350 | |
| Closed | Cendant Mobility Financial Corporation | $7,315 |
Source: Public Records
Tax History
| Year | Tax Paid | Tax Assessment Tax Assessment Total Assessment is a certain percentage of the fair market value that is determined by local assessors to be the total taxable value of land and additions on the property. | Land | Improvement |
|---|---|---|---|---|
| 2025 | $1,957 | $261,925 | $0 | $0 |
| 2024 | $183 | $230,165 | $0 | $0 |
| 2023 | $1,911 | $226,990 | $0 | $0 |
| 2022 | $1,943 | $226,985 | $0 | $0 |
| 2021 | $1,934 | $345,165 | $75,000 | $270,165 |
| 2020 | $1,815 | $302,194 | $75,000 | $227,194 |
| 2019 | $1,771 | $281,194 | $54,000 | $227,194 |
| 2018 | $1,638 | $251,560 | $54,000 | $197,560 |
| 2017 | $1,532 | $128,480 | $0 | $0 |
| 2016 | $1,559 | $128,480 | $0 | $0 |
| 2015 | $1,212 | $99,505 | $0 | $0 |
| 2014 | $1,200 | $100,495 | $0 | $0 |
| 2013 | -- | $100,495 | $0 | $0 |
Source: Public Records
Map
Nearby Homes
- 442 S 455 E
- 396 S 455 E
- 127 S 830 E Unit 304
- 641 S 380 E
- 434 S Cardon Ridge Dr
- 1092 E 300 S
- 161 E 560 S
- 1400 E 300 S
- 641 S 1080 E Unit 44
- 413 S 1150 E Unit 1101
- 670 S 1080 E Unit 37
- 577 S 1140 E Unit 1202
- 628 S 1080 E
- 805 S 270 E Unit 1
- 809 S 270 E Unit 2
- 206 S 100 E
- 145 E 650 S
- 12 S 1150 E Unit 8
- 813 S 270 E Unit 3
- 817 S 270 E Unit 4
Your Personal Tour Guide
Ask me questions while you tour the home.